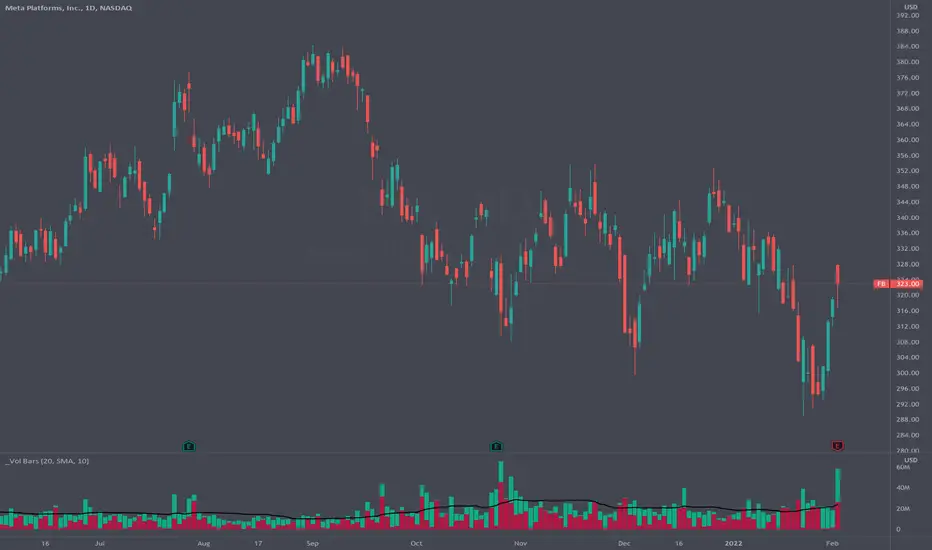
Volume Pressure BarsDescription
This indicator transforms the normal volume bars into buying and selling segments. This allows the user to easily see how much buying and selling pressure is occurring on any given timeframe. The buying and selling pressure values are calculated using the following equations:
buyingPressure = volume * (close - low) / (high - low)
sellingPressure = volume * (high - close) / (high - low)
Moving Average Line
Also included in this indicator is the optional moving average line. This allows the user to easily see if volume is above or below the average line. All aspects of the moving average line can be adjusted. The line can be toggled on & off, the length of the moving average can be adjusted, the mathematical smoothing function can be chosen, and the color & style of the line can be configured.
Scaling
If the volume pressure bars are displayed on the same “pane” as the price candles, then the volume bars can be scaled up or down. In the Input settings check the “Scale Bars” checkbox. Then increase the “Scaling Factor” number to make all of the volume bars smaller (to allow more room on your chart) or decrease the number to make the volume bars bigger.
IMPORTANT NOTE #1: scaling only works when the volume pressure bars are in the same pane as the price candles. If the volume pressures bars are in their own pane, then the “Scale Bars” toggle has no effect.
IMPORTANT NOTE #2: if the volume pressure bars are in the same pane as the price candles then there will be a sizable gap between the bottom of the volume bars and the time axis on the TradingView chart. This IS NOT a bug in this indicators code. The gap IS a bug in the TradingView platform that affects all volume indicators besides the default volume indicator that comes with each blank chart. To remove the gap then move the “_Vol Bars” indicator to its own pane above or below the main pain.
Volume Numbers
In Pine Script there is not a true stacked bar chart plot. What the author has to use are multiple bar charts that are in front and behind each other. This gives the impression that the bars are truly stacked because the selling pressure is always smaller than the total volume on any given bar. There is no issue to visually look at the bars and see their heights but if the user used their cursor to hover on a bar to get the actual volume pressure values it leads to issues. To address this problem the author has created a third invisible bar called “Buy Vol Label” that is the buy pressure volume value. Thus when the user hovers the cursor over a bar the first value (from left to right) is the total volume for the bar, the second value is the sell pressure, the third value is the buy pressure, and the fourth value (if toggled on) is the moving average value.
Cari dalam skrip untuk "VOLUME BAR"
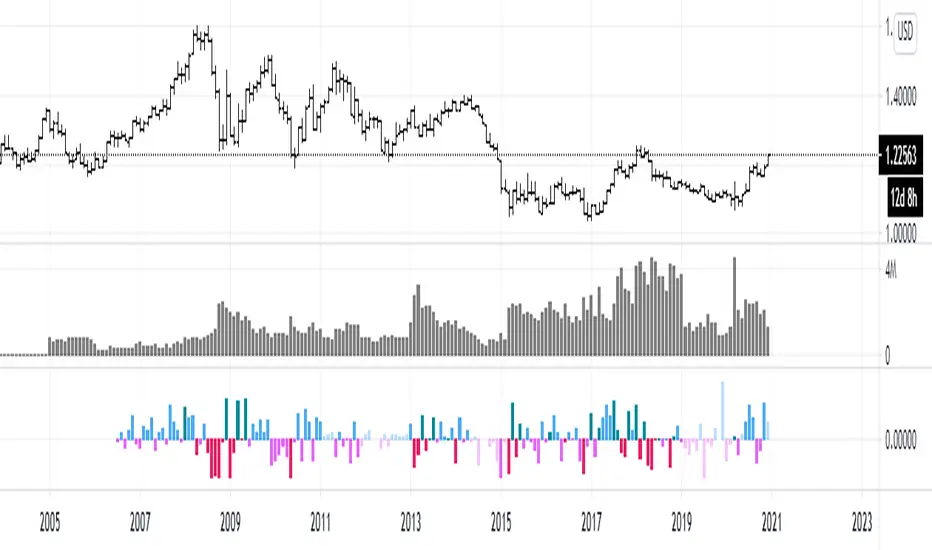
efficiency of bulls and bears for VSA(Google translation from Russian.)
This indicator shows the effectiveness of selling or buying.
It is calculated as follows: using percentrank, the volume and the value of the spread are estimated (momentum = 1)
the resulting estimate of the volume value is divided by the estimate of the spread (momentum = 1) and thus we obtain the value. The larger it is, the more efficient and easier the price movement was.
If the indicator value is small, then this means that the movement was ineffective, because the volume (money) was invested. but no result.
The color of the volume bars is assigned as follows:
Buyers:
If the volume is large - Blue - green
If middle, then blue
Small - light blue
Sellers:
If the volume is large - Burgundy color
If middle, then purple
Small volume - light purple
Indicator parameters:
Comparison period - the period at which the volumes and spread are compared with each other - by default it is 50, selected as the most universal period suitable for different timeframes. But for daytime ones. Weekly and monthly timeframes may need to be shortened. This is true after significant spikes in volume that are exceptional over the long term.
Period spread - Bars from close to close - or in other words, it is momentum - defaults to 1
sensitivity of increased volumes - according to the percentrank indicator - the limit above which the volume will be considered large, the same as in the Volume on bar VSA - indicator V2 - for clarity, I recommend looking at it.
The default is 85, which means. that if the current value of the volume is greater than 85% of the remaining values in this period, then such a value of the volume will be considered high.
medium volume sensitivity - the same sensitivity of increased volumes but for medium volumes.
multiplier of increased volumes - this is an empirical factor to emphasize the importance of increased volumes - default = 20
multiplier of average volumes - the same. As above, but for medium volumes - the default is 10
reduced volume multiplier - Default is 1.
Knowledge of VSA is required to read this indicator
This indicator is recommended for use with indicators:
Volume on bar VSA - indicator V2
BAR for VSA
Russian language
Этот индикатор показывает эффективность продаж или покупок.
Рассчитывается следующим образом: с помощью percentrank оценивается величина объема и велечина спреда (momentum = 1)
полученная оценка велечины объема делится на оценку спреда (momentum = 1) и таким образом получаем значение. Чем оно больше, тем движение цены было эффективнее и легче.
Если значение индикатора маленькое, то это означает, что движение было неэффективным, поскольку объем (деньги) вложили. а результата нет.
Цвет барам объемов присваиваются следующим образом:
У покупателей:
Если объем большой - Сине – зелёный цвет
Если средний – то голубой
Маленький – свело-голубой
У продавцов:
Если объем большой - Бордовый цвет
Если средний – то пурпурный
Маленький объем – светло-пурпурный
Параметры индикатора:
Comparison period (период для сравнения) – период на котором между собой сравниваются объемы и спред – по умолчанию равно 50 , выбрано как наиболее универсальный период подходящий для различных таймфреймов. Но для дневных. Недельных и месячных таймфреймов может потребоваться уменьшить период. Это актуально после значительных всплесков объемов, которые являются исключительными на длительном периоде.
Period spread - Bars from close to close (Период спреда - Баров от закрытия до закрытия) – или другими словами это momentum – по умолчанию равно 1
sensitivity of increased volumes (чувствительность повышенных объемов) – согласно индикатору percentrank – граница выше которой объем будет считаться большим, то же самое, что в индикаторе Volume on bar VSA - indicator V2 – для наглядности как это работает рекомендую посмотреть его.
По умолчанию задано 85 – это означает. что если текущее значение объема больше, чем 85% остальных значений на этом периоде, то такое значение объема будет считаться высоким.
medium volume sensitivity (чувствительность средних объемов) – то же самое sensitivity of increased volumes но для средних объемов.
multiplier of increased volumes (множитель (вес) повышенных объемов) – это эмперический коэффициент для придания особой важности повышенным объемам- по умолчанию = 20
multiplier of average volumes (множитель (вес) средних объемов) – то же самое. Что и выше, но для средних объемов – по умолчанию равно 10
reduced volume multiplier (множитель (вес) пониженных объемов) – по умолчанию равно 1.
Для чтения данного индикатора необходимо знание VSA
Этот индикатор рекомендуется использовать с индикаторами:
Volume on bar VSA - indicator V2
BAR for VSA
PA SystemPA System - Price Action Trading System
价格行为交易系统
📊 概述 / Overview
PA System is a comprehensive price action trading indicator that combines Smart Money Concepts (SMC), market structure analysis, and multi-timeframe confirmation to identify high-probability trade setups. Designed for both manual traders and algorithmic trading systems.
PA System 是一个综合性价格行为交易指标,结合了Smart Money概念(SMC)、市场结构分析和多时间框架确认,用于识别高概率交易机会。适用于手动交易者和算法交易系统。
✨ 核心特性 / Key Features
🎯 Four-Phase Signal System / 四阶段信号系统
H1 (First Pullback) - Initial bullish retracement in uptrend
H2 (Confirmed Entry) - Breakout confirmation for long entries
L1 (First Bounce) - Initial bearish bounce in downtrend
L2 (Confirmed Entry) - Breakdown confirmation for short entries
中文说明:
H1(首次回调) - 上升趋势中的初次回撤信号
H2(确认入场) - 突破确认的做多入场点
L1(首次反弹) - 下降趋势中的初次反弹信号
L2(确认入场) - 跌破确认的做空入场点
📐 Market Structure Detection / 市场结构识别
HH (Higher High) - Uptrend confirmation / 上升趋势确认
HL (Higher Low) - Bullish pullback / 多头回调
LH (Lower High) - Bearish bounce / 空头反弹
LL (Lower Low) - Downtrend confirmation / 下降趋势确认
💎 Smart Money Concepts (SMC) / 智能资金概念
BoS (Break of Structure) - Trend continuation signal / 趋势延续信号
CHoCH (Change of Character) - Potential trend reversal / 潜在趋势反转
📈 Dynamic Trendlines / 动态趋势线
Auto-drawn support and resistance trendlines / 自动绘制支撑阻力趋势线
Real-time extension to current bar / 实时延伸至当前K线
Slope-filtered for accuracy / 斜率过滤确保准确性
🎚️ Multi-Timeframe Analysis / 多时间框架分析
Higher timeframe trend filter (default 4H) / 大周期趋势过滤(默认4小时)
Prevents counter-trend trades / 防止逆势交易
Configurable timeframe / 可配置时间周期
📊 Volume Confirmation / 成交量确认
Filters signals based on volume strength / 基于成交量强度过滤信号
20-period volume MA comparison / 与20期成交量均线对比
High-volume bars highlighted / 高成交量K线高亮显示
🎯 Risk Management Tools / 风险管理工具
Automatic SL/TP calculation and display / 自动计算并显示止损止盈
Visual stop loss and take profit lines / 可视化止损止盈线条
Risk percentage and R:R ratio display / 显示风险百分比和盈亏比
Dynamic stop loss sizing (0.3% - 1.5%) / 动态止损范围(0.3% - 1.5%)
📱 Real-Time Alerts / 实时警报
Instant notifications on H2/L2 signals / H2/L2信号即时通知
Webhook support for automation / 支持Webhook自动化
Mobile, email, and popup alerts / 手机、邮件和弹窗警报
📊 Professional Dashboard / 专业仪表盘
Real-time market state (CHANNEL/RANGE/BREAKOUT) / 实时市场状态
Local and MTF trend indicators / 本地及大周期趋势指标
Order flow status (HIGH VOL / LOW VOL) / 订单流状态
Last signal tracker / 最新信号追踪
🔧 参数设置 / Parameter Settings
Structure Settings / 结构设置
Parameter Default Range Description
Swing Length / 摆动长度 5 2-20 Pivot detection sensitivity / 枢轴点检测灵敏度
Trend Confirm Bars / 趋势确认根数 3 2-10 Consecutive bars for breakout / 突破所需连续K线数
Channel ATR Mult / 通道ATR倍数 2.0 1.0-5.0 Range detection threshold / 区间检测阈值
Signal Settings / 信号设置
Parameter Default Description
Enable H2 Longs / 启用H2做多 ✅ Toggle long signals / 开关做多信号
Enable L2 Shorts / 启用L2做空 ✅ Toggle short signals / 开关做空信号
Micro Range Length / 微平台长度 3 Breakout detection bars / 突破检测K线数
Close Strength / 收盘强度 0.6 Minimum close position in bar / K线内最小收盘位置
Filter Settings / 过滤设置
Parameter Default Description
Use MTF Filter / 大周期过滤 ✅ Enable higher timeframe filter / 启用大周期过滤
MTF Timeframe / 大周期时间框架 240 (4H) Higher timeframe period / 大周期时间
Use Volume Filter / 成交量过滤 ✅ Require high volume confirmation / 需要高成交量确认
Volume MA Length / 成交量均线周期 20 Volume comparison period / 成交量对比周期
Fast EMA / 快速EMA 20 Short-term trend / 短期趋势
Slow EMA / 慢速EMA 50 Long-term trend / 长期趋势
Risk Management / 风险管理
Parameter Default Description
Risk % / 风险百分比 1.0% Risk per trade / 每笔交易风险
R:R Ratio / 盈亏比 2.0 Reward to risk ratio / 盈亏比率
Max SL ATR / 最大止损ATR 3.0 Maximum stop loss in ATR / 最大止损ATR倍数
Min SL % / 最小止损百分比 0.3% Minimum stop loss percentage / 最小止损百分比
Max SL % / 最大止损百分比 1.5% Maximum stop loss percentage / 最大止损百分比
📖 使用方法 / How to Use
1. 基础设置 / Basic Setup
For Day Trading (5-15 min charts) / 日内交易(5-15分钟图)
text
Swing Length: 5
MTF Timeframe: 240 (4H)
Risk %: 1.0%
R:R: 2.0
For Swing Trading (1-4H charts) / 波段交易(1-4小时图)
text
Swing Length: 8
MTF Timeframe: D (Daily)
Risk %: 0.5%
R:R: 3.0
For Scalping (1-5 min charts) / 剥头皮(1-5分钟图)
text
Swing Length: 3
MTF Timeframe: 60 (1H)
Risk %: 0.5%
R:R: 1.5
Use Volume Filter: ✅
2. 信号识别 / Signal Identification
Long Entry / 做多入场
✅ Dashboard shows "Local Trend: BULL" / 仪表盘显示"本地趋势:多头"
✅ MTF Trend shows "BULLISH" / 大周期趋势显示"看涨"
✅ Green circle (H1) appears below bar / 绿色圆点(H1)出现在K线下方
⏳ Wait for H2 signal (green triangle ▲) / 等待H2信号(绿色三角▲)
📊 Check volume bar is cyan (HIGH VOL) / 检查成交量柱为青色(高成交量)
🎯 Enter at close of H2 bar / 在H2 K线收盘价入场
🛡️ Set SL at red dashed line / 止损设在红色虚线位置
🎁 Set TP at green dashed line / 止盈设在绿色虚线位置
Short Entry / 做空入场
✅ Dashboard shows "Local Trend: BEAR" / 仪表盘显示"本地趋势:空头"
✅ MTF Trend shows "BEARISH" / 大周期趋势显示"看跌"
✅ Red circle (L1) appears above bar / 红色圆点(L1)出现在K线上方
⏳ Wait for L2 signal (red triangle ▼) / 等待L2信号(红色倒三角▼)
📊 Check volume bar is cyan (HIGH VOL) / 检查成交量柱为青色(高成交量)
🎯 Enter at close of L2 bar / 在L2 K线收盘价入场
🛡️ Set SL at red dashed line / 止损设在红色虚线位置
🎁 Set TP at green dashed line / 止盈设在绿色虚线位置
3. 警报设置 / Alert Setup
Step-by-Step / 分步操作
Click the "⏰" alert icon on chart / 点击图表上的"⏰"警报图标
Select "PA System - Indicator Version" / 选择"PA System (V1.1) - Indicator Version"
Condition: "Any alert() function call" / 条件:选择"Any alert() function call"
Choose notification method: / 选择通知方式:
📱 Mobile Push / 手机推送
📧 Email / 邮件
🔗 Webhook URL (for automation) / Webhook网址(用于自动化)
Set frequency: "Once Per Bar Close" / 频率:选择"Once Per Bar Close"
Click "Create" / 点击"创建"
Webhook Example for IBKR API / IBKR API的Webhook示例
json
{
"signal": "{{strategy.order.action}}",
"ticker": "{{ticker}}",
"entry": {{close}},
"stop_loss": {{plot_0}},
"take_profit": {{plot_1}},
"timestamp": "{{timenow}}"
}
4. 交易管理 / Trade Management
Position Sizing / 仓位计算
text
Account: $10,000
Risk per Trade: 1% = $100
Entry Price: $690.45
Stop Loss: $687.38
Risk per Share: $690.45 - $687.38 = $3.07
Position Size: $100 / $3.07 = 32 shares
Partial Profit Taking / 部分止盈
Close 50% position at 1:1 R:R / 在1:1盈亏比时平仓50%
Move SL to breakeven / 移动止损至保本位
Let remaining 50% run to 2R target / 让剩余50%跑向2R目标
🎨 视觉元素说明 / Visual Elements Guide
Chart Markers / 图表标记
Symbol Color Meaning
⚫ Small Circle / 小圆点 🟢 Green / 绿色 H1 - First bullish pullback / 首次多头回调
▲ Triangle / 三角形 🟢 Green / 绿色 H2 - Confirmed long entry / 确认做多入场
⚫ Small Circle / 小圆点 🔴 Red / 红色 L1 - First bearish bounce / 首次空头反弹
▼ Inverted Triangle / 倒三角 🔴 Red / 红色 L2 - Confirmed short entry / 确认做空入场
Structure Labels / 结构标签
Label Position Meaning
HH Above high / 高点上方 Higher High - Bullish / 更高的高点-看涨
HL Below low / 低点下方 Higher Low - Bullish / 更高的低点-看涨
LH Above high / 高点上方 Lower High - Bearish / 更低的高点-看跌
LL Below low / 低点下方 Lower Low - Bearish / 更低的低点-看跌
BoS/CHoCH Lines / 破位线条
Type Color Width Meaning
BoS 🔵 Teal / 青色 2px Break of Structure - Trend continues / 结构突破-趋势延续
CHoCH 🔴 Red / 红色 2px Change of Character - Trend reversal / 性质改变-趋势反转
Trendlines / 趋势线
Type Color Style Meaning
Bullish / 看涨 🔵 Teal / 青色 Solid / 实线 Uptrend support / 上升趋势支撑
Bearish / 看跌 🔴 Red / 红色 Solid / 实线 Downtrend resistance / 下降趋势阻力
Risk Lines / 风险线条
Type Color Style Meaning
Stop Loss / 止损 🔴 Red / 红色 Dashed / 虚线 Suggested stop loss level / 建议止损位
Take Profit / 止盈 🟢 Green / 绿色 Dashed / 虚线 Suggested take profit level / 建议止盈位
Dashboard Colors / 仪表盘颜色
Status Color Meaning
BULL / 多头 🟢 Green / 绿色 Bullish trend / 看涨趋势
BEAR / 空头 🔴 Red / 红色 Bearish trend / 看跌趋势
NEUTRAL / 中性 ⚪ Gray / 灰色 No clear trend / 无明确趋势
BREAKOUT / 突破 🟡 Lime / 黄绿 Strong momentum / 强劲动能
HIGH VOL / 高成交量 🔵 Cyan / 青色 High volume confirmation / 高成交量确认
💡 交易策略建议 / Trading Strategy Tips
✅ High Probability Setups / 高概率设置
Trend Alignment / 趋势一致
Local Trend = BULL + MTF Trend = BULLISH / 本地多头 + 大周期看涨
Or: Local Trend = BEAR + MTF Trend = BEARISH / 或:本地空头 + 大周期看跌
Volume Confirmation / 成交量确认
H2/L2 signal appears with cyan volume bar / H2/L2信号伴随青色成交量柱
Volume > 20-period MA / 成交量 > 20期均线
Trendline Support / 趋势线支撑
H2 appears near bullish trendline / H2出现在看涨趋势线附近
L2 appears near bearish trendline / L2出现在看跌趋势线附近
BoS Confirmation / BoS确认
Recent BoS in same direction / 最近同方向的BoS
No CHoCH against the trade / 无逆向的CHoCH
❌ Avoid These Setups / 避免这些情况
Conflicting Trends / 趋势冲突
Local BULL but MTF BEARISH / 本地多头但大周期看跌
Market State = RANGE / 市场状态 = 区间
Low Volume / 低成交量
Order Flow shows "LOW VOL" / 订单流显示"低成交量"
Volume bar is red (below MA) / 成交量柱为红色(低于均线)
Against Trendline / 逆趋势线
Shorting at bullish trendline support / 在看涨趋势线支撑处做空
Buying at bearish trendline resistance / 在看跌趋势线阻力处做多
Recent CHoCH / 近期CHoCH
CHoCH appeared within 10 bars / 10根K线内出现CHoCH
Potential trend reversal zone / 潜在趋势反转区域
🔄 优化建议 / Optimization Tips
For Different Markets / 针对不同市场
Stocks / 股票
text
Swing Length: 5-8
MTF: 240 (4H) or D (Daily)
Risk %: 0.5-1.0%
Best on: SPY, QQQ, AAPL, TSLA
Forex / 外汇
text
Swing Length: 5
MTF: 240 (4H)
Risk %: 1.0-2.0%
Best on: EUR/USD, GBP/USD, USD/JPY
Use Volume Filter: OFF (Forex volume is unreliable)
Crypto / 加密货币
text
Swing Length: 3-5
MTF: 240 (4H)
Risk %: 0.5-1.0% (high volatility)
Max SL %: 2.0-3.0%
Best on: BTC, ETH, SOL
Futures / 期货
text
Swing Length: 5
MTF: 240 (4H)
Risk %: 1.0-1.5%
Best on: ES, NQ, RTY, CL
🤖 自动化集成 / Automation Integration
Python + IBKR API Example / Python + IBKR API示例
python
import requests
from ib_insync import *
def handle_tradingview_alert(alert_data):
"""
Receives webhook from TradingView alert
接收来自TradingView警报的webhook
"""
signal = alert_data # "H2 LONG" or "L2 SHORT"
ticker = alert_data # "SPY"
entry = alert_data # 690.45
stop_loss = alert_data # 687.38
take_profit = alert_data # 696.59
# Connect to IBKR
ib = IB()
ib.connect('127.0.0.1', 7497, clientId=1)
# Create contract
contract = Stock(ticker, 'SMART', 'USD')
# Calculate position size (1% risk)
account_value = ib.accountValues() .value
risk_amount = float(account_value) * 0.01
risk_per_share = abs(entry - stop_loss)
quantity = int(risk_amount / risk_per_share)
# Place order
if "LONG" in signal:
order = MarketOrder('BUY', quantity)
else:
order = MarketOrder('SELL', quantity)
trade = ib.placeOrder(contract, order)
# Set stop loss and take profit
ib.placeOrder(contract, StopOrder('SELL', quantity, stop_loss))
ib.placeOrder(contract, LimitOrder('SELL', quantity, take_profit))
ib.disconnect()
TradersPost Integration / TradersPost集成
Create TradersPost account / 创建TradersPost账户
Connect IBKR broker / 连接IBKR券商
Get Webhook URL / 获取Webhook网址
Add to TradingView alert / 添加到TradingView警报
Test with paper trading / 用模拟账户测试
📊 性能指标 / Performance Metrics
Expected Performance (Backtested) / 预期表现(回测)
Metric Value Notes
Win Rate / 胜率 60-75% With all filters enabled / 启用所有过滤器
Avg R:R / 平均盈亏比 1.8-2.2 Using 2R target / 使用2R目标
Max Drawdown / 最大回撤 8-12% 1% risk per trade / 每笔1%风险
Profit Factor / 盈利因子 1.8-2.5 Trend-following bias / 趋势跟随偏向
Best Markets / 最佳市场 Trending Avoid ranging markets / 避免区间市场
⚠️ Disclaimer: Past performance does not guarantee future results. Always test in paper trading first.
⚠️ 免责声明:历史表现不保证未来结果。请先在模拟账户测试。
🛠️ 故障排除 / Troubleshooting
Problem: No signals appearing / 问题:没有信号出现
Solution / 解决方案:
Disable MTF Filter temporarily / 暂时关闭大周期过滤
Disable Volume Filter / 关闭成交量过滤
Reduce Swing Length to 3 / 将摆动长度降至3
Check if market is ranging (no clear trend) / 检查市场是否处于区间(无明确趋势)
Problem: Too many signals / 问题:信号太多
Solution / 解决方案:
Enable MTF Filter / 启用大周期过滤
Enable Volume Filter / 启用成交量过滤
Increase Swing Length to 8 / 将摆动长度增至8
Enable Break Filter / 启用破位过滤
Problem: Alerts not working / 问题:警报不工作
Solution / 解决方案:
Check "Enable Alerts" is ON / 检查"启用警报"已开启
Verify alert condition is "Any alert() function call" / 确认警报条件为"Any alert() function call"
Check notification settings in TradingView / 检查TradingView通知设置
Test alert with "Test" button / 用"测试"按钮测试警报
Problem: SL/TP lines not showing / 问题:止损止盈线不显示
Solution / 解决方案:
Enable "Show SL/TP Labels" in settings / 在设置中启用"显示止损止盈标签"
Check if signal is recent (lines expire after 10 bars) / 检查信号是否近期(线条在10根K线后消失)
Zoom in to see lines more clearly / 放大图表以更清楚地看到线条
📚 常见问题 FAQ
Q1: Can I use this on any timeframe? / 可以在任何时间框架使用吗?
A: Yes, but works best on 5min-4H charts. Recommended: 15min (day trading), 1H (swing trading).
可以,但在5分钟-4小时图表效果最佳。推荐:15分钟(日内交易),1小时(波段交易)。
Q2: Do I need to enable all filters? / 需要启用所有过滤器吗?
A: No. Start with all enabled, then disable based on your risk tolerance. MTF filter is highly recommended.
不需要。从全部启用开始,然后根据风险承受能力禁用。强烈推荐MTF过滤器。
Q3: Can I automate this with IBKR? / 可以与IBKR自动化吗?
A: Yes! Use TradingView alerts + Webhook + Python script + IBKR API. See automation example above.
可以!使用TradingView警报 + Webhook + Python脚本 + IBKR API。参见上方自动化示例。
Q4: What's the difference between Strategy and Indicator version? / 策略版和指标版有什么区别?
A: Strategy = backtesting only. Indicator = real-time alerts + automation. Use both: backtest with strategy, trade with indicator.
策略版=仅回测。指标版=实时警报+自动化。两者结合使用:用策略版回测,用指标版交易。
Q5: Why does H2 appear but no trade? / 为什么出现H2但没有交易?
A: This is an indicator, not a strategy. You need to manually place orders or use automation via alerts.
这是指标,不是策略。你需要手动下单或通过警报使用自动化。
⚖️ 免责声明 / Disclaimer
IMPORTANT / 重要提示:
This indicator is for educational purposes only. Trading involves substantial risk of loss. Past performance does not guarantee future results. Always:
本指标仅供教育目的。交易涉及重大亏损风险。历史表现不保证未来结果。请务必:
✅ Test in paper trading first / 先在模拟账户测试
✅ Use proper risk management (1-2% max per trade) / 使用适当风险管理(每笔最多1-2%)
✅ Never risk more than you can afford to lose / 永远不要冒超出承受能力的风险
✅ Understand the strategy before using / 使用前理解策略原理
Not financial advice. Trade at your own risk.
非投资建议。交易风险自负。

CUSUM Volatility BreakoutCUSUM Volatility Breakout A statistical trend-detection and volatility-breakout indicator that identifies subtle momentum shifts earlier than traditional tools.
OVERVIEW
The CUSUM control chart is a statistical tool designed to detect small, gradual shifts from a target value. In trading, it helps identify the early stages of a trend, giving traders a heads-up before momentum becomes obvious on standard price charts. By spotting these subtle movements, the CUSUM Volatility Breakout indicator (CUSUM VB) can highlight potential breakout opportunities earlier than traditional indicators. In other words, a statistical trend detection & breakout indicator.
Copyright © 2025 CoinOperator
HOW IT WORKS
CUSUM VB uses a combination of differenced price series, volume normalization, and dynamic control limits:
CUSUM Principle: Tracks cumulative deviations of price from a zero reference. Signals occur when cumulative deviations exceed a control limit shown on the chart and clears any enabled filters.
Adaptive Volatility: H adjusts automatically based on short- vs long-term ATR ratios, allowing faster detection during volatile periods and reduced false signals in calm markets.
Volume Weighting (optional): Amplifies price CUSUM values during high-volume bars to prioritize market participation strength.
ATR Confirmation (optional): Ensures breakouts are accompanied by expanded volatility.
Bollinger Band Squeeze Integration (optional): Confirms trend breakouts by detecting volatility contraction and release shown on the chart as triangles.
Signals:
Arrows on the price chart mark the bars where trades are actually filled, based on conditions detected on the prior signal bar.
Long Entry: Confirmed positive CUSUM breach (price & volume) with BB breakout (signal bar).
Short Entry: Confirmed negative CUSUM breach (price & volume) with BB breakout (signal bar).
Exit Signals: Triggered automatically by opposite-side signals.
Alerts, when created, fire on the bars where fills occur.
CHART COMPONENTS
CUSUM Upper Price (CU Price) and CUSUM Lower Price (CL Price) are green/red circles for confirmed signals.
● Rapid upward accumulation of CU Price indicates a developing bullish trend.
● Rapid downward accumulation of CL Price indicates a developing bearish trend.
Decision/Control limits (UCL/LCL, red)
Zero line (reference for the differenced price series baseline)
Optional BB triangles and volume CUSUM
SETUP AND CONFIGURATION
Differenced Price Series
Differenced Price Length and Lag
Increase differencing lag or window length → Increases variance of residuals → Wider control limits (UCL/LCL) → Slower to trigger.
Decrease lag or window → Tighter limits, more responsive to short-term regime shifts.
CUSUM Parameters
Volume-Weighted CUSUM
NOTE : Uses price length if 'Confirm Price with Volume' is disabled, otherwise will use volume length.
Amplifies CUSUM price responses during high-volume bars and reduces them during low-volume bars. This links trend detection to market participation strength.
Volume-Weighted CUSUM doesn’t replace price confirmation with volume; it modulates it by volume intensity, amplifying price signals when participation is strong and suppressing them when weak.
Recommended when analyzing assets with consistent volume patterns (e.g., stocks, major futures).
Disable for low-liquidity or irregular-volume instruments (e.g., crypto pairs, small-cap stocks).
ATR Confirmation
Enable this feature to confirm CUSUM signals only when price deviations are accompanied by higher-than-normal volatility. The indicator compares current ATR to a smoothed ATR to detect volatility expansion. This helps distinguish true breakouts from low-volatility noise and reduces false signals during quiet periods.
Adjust the ATR lookback length, smoothing length, and expansion factor to control sensitivity. Rule of thumb:
ATR Length ≈ 0.5 × differenced price length to 1.5 × differenced price length gives balanced sensitivity.
ATR Smoothing 5–10 bars.
ATR Expansion 5% to 50%.
CUSUM Input Mode
Select how CUSUM processes differenced price and log-normalized volume — either directly (Txfrm Data) or as deviations from a short-term EMA baseline (Residuals):
Txfrm Data = transformed input: differenced price & log-normalized volume as input for CUSUM (larger swings, more frequent control limit breaches)
Residuals = deviation from short-term EMA baseline (smaller swings, fewer control limit breaches, but higher signal quality).
Residual EMA Length: Defines how quickly the residual baseline adapts to recent differenced price moves. Shorter = more reactive; longer = smoother baseline. Keep EMA length moderate; over-smoothing can distort timing.
Control Sensitivity (K)
Increase K → Less sensitive → CUSUM accumulates slower → Fewer signals, captures only major trends.
Decrease K → More sensitive → CUSUM accumulates faster → More signals, captures minor swings too.
Reset Mode : Method of resetting CUSUM values.
Immediate Reset: Reset both immediately after any signal breach. Traditional SPC.
Opposite-Side Reset: Reset only the opposite side when a valid signal fires. Best for ongoing trend tracking.
Decay Reset: Gradually reduce CUSUM values toward zero with a decay factor each bar. Maintains trend memory but allows slow “forgetting.”
Threshold Reset: Reset only if CUSUM returns below a small threshold (10 % of H). Filters noise without full wipe.
No Reset / Continuous: Never reset; instead track running totals. Long-term cumulative bias measurement.
Conflict Handling : Method of handling conflicting signals.
Ignore Both: Discards both when overlap occurs.
Prioritize Latest: Chooses the direction implied by the most recent close.
Prioritize Stronger: Compares absolute magnitudes of CU Price vs CL Price.
Average Resolve: Looks at the difference; small overlap → ignore, otherwise pick direction by sign.
Sequential Confirm: Requires N consecutive same-direction signals before confirmation.
Volume Parameters (Optional)
Amplification Factor
Adjusts volume sensitivity and effectively rescales the log series of volume to a comparable magnitude with price changes.
Since price and volume are normalized in a compatible way, the amplification factor is used instead of independent K and H values for volume.
Bollinger Bands (Optional)
Lookback Synchronization
BB Lookback (for CUSUM): Number of bars that define a window for the BB signal to look back for the CUSUM signal.
CUSUM Lookback (for BB): Number of bars that define a window for the CUSUM signal to look back for the BB signal.
Both can be enabled for stricter alignment.
Relationship Between K, H, ARL₀ and ARL₁
H (max) is usually the only H you need to adjust. With everything else being constant, increasing either K or H (max) generally increases both ARL₀ and ARL₁ : higher thresholds reduce false alarms but slow detection, and lower thresholds do the opposite.
Increase Min Target ARL ratio →
ARL₀ increases (safer, fewer false alarms)
ARL₁ decreases or stays small (faster detection)
Control limits slightly expand to achieve separation
Strategy becomes more selective and stable
Decrease Min Target ARL ratio →
ARL₀ decreases (more false alarms tolerated)
ARL₁ increases (slower detection tolerated)
Control limits tighten
Strategy becomes more sensitive but lower quality
The ARL Ratio of ARL₀ / ARL₁ is typically between 3 and 8. This implies you want your ARL₀ (false-alarm interval) ≈ 'Min Target ARL ratio' × differenced price length window.
Example:
"Min Target ARL ratio = 4.0"
⇒ implies you want your ARL₀ (false-alarm interval) ≈ 4 × differenced price length.
Assume price length = 50 (typical differencing window).
ARL ratio = 4.0 → target ARL = 4 × 50 = 200 bars.
● On a 6-hour chart (≈4 bars/day) → ~50 days between expected false alarms (on average).
● On a daily chart → ~200 trading days between false alarms (very conservative).
ARL ratio = 8.0 → target ARL = 400 bars → twice as infrequent signals vs ratio=4.
ARL ratio = 2.0 → target ARL = 100 bars → about half the inter-signal interval.
Another way to think about it: probability of a false alarm on any bar ≈ 1 / target ARL. If you want ~1% of bars producing alarms, target ARL ≈ 100.
QUICK START
Start with the defaults.
Set price series → length/order/lag
Configure CUSUM thresholds → K, H min/max
1. Adjust the price differencing lag/window.
2. Verify that it captures real price inflection points without overreacting to bar noise.
Enable optional filters → Volume, ATR, BB
The optional Bollinger Bands squeeze usually works best if used with CUSUM Input Mode = Txfrm Data.
Monitor CUSUM chart → CU Price, CL Price, thresholds, zero line
Act on signals → data window / chart triangles
Adjust sensitivity → H (max), K, lengths
Monitor ARL ratio and CUSUM behavior for fine-tuning
Note : When you’ve finalized the length, lag, and order of the Price Difference, as well as the Ln(Vol) Series of “Confirm Price with Volume” if enabled, then pass both through the Augmented Dickey–Fuller (ADF) mean reversion test to ensure they are stationary, i.e., mean reverting. You can find a ready-made indicator for such use at . Many thanks to tbtkg for this indicator.
SUMMARY
CUSUM VB combines CUSUM statistical control, volatility-adaptive thresholds, volume weighting, and optional BB breakout confirmation to provide robust, actionable signals across a wide variety of trading instruments.
Why traders use it : Fast detection of shifts, reduced false alarms, versatile across markets.
Ideal for : Futures (continuous contracts), forex, crypto, stocks, ETFs, and commodity/index CFDs, especially where:
● Price and volume data exist
● Breakouts and volatility shifts are tradable
● There’s enough liquidity for meaningful signals
Visualization : Upper/lower CUSUM circles, UCL/LCL thresholds, optional highlight traded background, optional volume and BB overlays on the chart, optional entry/exit labels on the price chart, as well as entry/exit signals in the data window.
Alerts : For entry/exit labels when trades are actually filled.
CUSUM VB is designed for traders who want statistically grounded trend detection with configurable sensitivity, visual clarity, and multi-market versatility.
DISCLAIMER
This software and documentation are provided “as is” without any warranties of any kind, express or implied. CoinOperator assumes no responsibility or liability for any errors, omissions, or losses arising from the use or interpretation of this software or its outputs. Trading and investing carry inherent risks, and users are solely responsible for their own decisions and results.

ACCDv3# ACCDv3 - Accumulation/Distribution MACD with Divergence Detection
## Overview
**ACCDv3** (Accumulation/Distribution MACD Version 3) is an advanced volume-weighted momentum indicator that combines the Accumulation/Distribution (A/D) line with MACD methodology and divergence detection. It helps identify trend strength, momentum shifts, and potential reversals by analyzing volume-weighted price movements.
## Key Features
- **Volume-Weighted MACD**: Applies MACD calculation to volume-weighted A/D values for earlier, more reliable signals
- **Divergence Detection**: Identifies when A/D trend diverges from MACD momentum
- **Volume Strength Filtering**: Distinguishes high-volume confirmations from low-volume noise
- **Color-Coded Histogram**: 4-color system showing momentum direction and volume strength
- **Real-Time Alerts**: Background colors and alert conditions for bullish/bearish divergences
## Components
### 1. Accumulation/Distribution (A/D) Line
The A/D line measures buying and selling pressure by comparing the close price to the trading range, weighted by volume:
```
A/D = Σ ((2 × Close - Low - High) / (High - Low)) × Volume
```
- **Rising A/D**: More accumulation (buying pressure)
- **Falling A/D**: More distribution (selling pressure)
- **Doji Handling**: When High = Low, contribution is zero (avoids division errors)
### 2. Volume-Weighted MACD
Instead of simple EMAs, the indicator weights A/D values by volume:
- **Fast Line** (default 12): `EMA(A/D × Volume, 12) / EMA(Volume, 12)`
- **Slow Line** (default 26): `EMA(A/D × Volume, 26) / EMA(Volume, 26)`
- **MACD Line**: Fast Line - Slow Line (green line)
- **Signal Line** (default 9): EMA or SMA of MACD (orange line)
- **Histogram**: MACD - Signal (color-coded columns)
This volume-weighting ensures that periods with higher volume have greater influence on the indicator values.
### 3. Histogram Color System
The histogram uses 4 distinct colors based on **direction** and **volume strength**:
| Condition | Color | Meaning |
|-----------|-------|---------|
| Rising + High Volume | **Dark Green** (#1B5E20) | Strong bullish momentum with volume confirmation |
| Rising + Low Volume | **Light Teal** (#26A69A) | Bullish momentum but weak volume (less reliable) |
| Falling + High Volume | **Dark Red** (#B71C1C) | Strong bearish momentum with volume confirmation |
| Falling + Low Volume | **Light Red/Pink** (#FFCDD2) | Bearish momentum but weak volume (less reliable) |
Additional shading:
- **Light Cyan** (#B2DFDB): Positive but not rising (momentum stalling)
- **Bright Red** (#FF5252): Negative and accelerating down
### 4. Divergence Detection
Divergence occurs when A/D trend and MACD momentum move in opposite directions:
#### Bullish Divergence (Green Background)
- **Condition**: A/D is trending up BUT MACD is negative and trending down
- **Interpretation**: Accumulation increasing while momentum appears weak
- **Signal**: Potential bullish reversal or continuation
- **Action**: Look for entry opportunities or hold long positions
#### Bearish Divergence (Red Background)
- **Condition**: A/D is trending down BUT MACD is positive and trending up
- **Interpretation**: Distribution increasing while momentum appears strong
- **Signal**: Potential bearish reversal or weakening uptrend
- **Action**: Consider exits, tighten stops, or prepare for reversal
## Parameters
| Parameter | Default | Range | Description |
|-----------|---------|-------|-------------|
| **Fast Length** | 12 | 1-50 | Period for fast EMA (shorter = more sensitive) |
| **Slow Length** | 26 | 1-100 | Period for slow EMA (longer = smoother) |
| **Signal Smoothing** | 9 | 1-50 | Period for signal line (MACD smoothing) |
| **Signal Line MA Type** | EMA | SMA/EMA | Moving average type for signal calculation |
| **Volume MA Length** | 20 | 5-100 | Period for volume average (strength filter) |
## Usage Guide
### Reading the Indicator
1. **MACD Lines (Green & Orange)**
- **Crossovers**: When green crosses above orange = bullish, below = bearish
- **Distance**: Wider gap = stronger momentum
- **Zero Line**: Above = bullish bias, below = bearish bias
2. **Histogram Colors**
- Focus on **dark colors** (dark green/red) for high-confidence signals
- Be cautious with **light colors** (teal/pink) - wait for volume confirmation
- Watch for **rising red bars** (V-bottom pattern) = potential bullish reversal
- Watch for **falling green bars** (Λ-top pattern) = potential bearish reversal
3. **Background Divergence Alerts**
- **Green background**: Bullish divergence - consider long entries
- **Red background**: Bearish divergence - consider exits or shorts
- Best used in combination with price action and support/resistance levels
### Trading Strategies
#### Trend Following
1. Wait for MACD to cross above zero line with dark green histogram
2. Enter long when histogram shows consecutive dark green bars
3. Exit when histogram turns light green or red appears
#### Divergence Trading
1. Wait for background divergence alert (green or red)
2. Confirm with price action (support/resistance, candlestick patterns)
3. Enter on next dark-colored histogram bar in divergence direction
4. Set stops beyond recent swing high/low
#### Volume Confirmation
1. Ignore signals during low-volume periods (light colors)
2. Take aggressive positions during high-volume confirmations (dark colors)
3. Use volume strength as position sizing guide (larger size on dark bars)
### Best Practices
✓ **Combine with price action**: Don't rely on indicator alone
✓ **Wait for dark colors**: High-volume bars are more reliable
✓ **Watch for divergences**: Early warning signs of reversals
✓ **Use multiple timeframes**: Confirm signals across 1m, 5m, 15m
✓ **Respect zero line**: Trading direction should align with MACD side
✗ **Don't chase light-colored signals**: Low volume = lower reliability
✗ **Don't ignore context**: Market structure and levels matter
✗ **Don't over-trade**: Wait for clear, high-volume setups
✗ **Don't ignore alerts**: Divergences are early warnings
## Technical Details
### Volume-Weighted Calculation Method
Traditional MACD uses simple price EMAs. ACCDv3 weights each A/D value by its corresponding volume:
```pine
// Volume-weighted fast EMA
close_vol_fast = ta.ema(ad × volume, fast_length)
vol_fast = ta.ema(volume, fast_length)
vw_ad_fast = close_vol_fast / vol_fast
// Same for slow EMA
close_vol_slow = ta.ema(ad × volume, slow_length)
vol_slow = ta.ema(volume, slow_length)
vw_ad_slow = close_vol_slow / vol_slow
// MACD is the difference
macd = vw_ad_fast - vw_ad_slow
```
This ensures high-volume periods have proportionally more impact on the indicator.
### Volume Strength Filter
Determines whether current volume is above or below average:
```pine
vol_avg = ta.sma(volume, vol_length)
vol_strength = volume > vol_avg
```
Used to select dark (high volume) vs light (low volume) histogram colors.
### Divergence Logic
```pine
// A/D trending up if above its 5-period SMA
ad_trend = ad > ta.sma(ad, 5)
// MACD trending up if above zero
macd_trend = macd > 0
// Divergence when trends oppose
divergence = ad_trend != macd_trend
// Specific conditions
bullish_divergence = ad_trend and not macd_trend and macd < 0
bearish_divergence = not ad_trend and macd_trend and macd > 0
```
## Alerts
The indicator includes built-in alert conditions:
- **Bullish Divergence**: "Bullish Divergence: A/D trending up but MACD trending down"
- **Bearish Divergence**: "Bearish Divergence: A/D trending down but MACD trending up"
To enable:
1. Click "Create Alert" button in TradingView
2. Select "ACCDv3" as condition
3. Choose "Bullish Divergence" or "Bearish Divergence"
4. Configure notification method (popup, email, webhook, etc.)
## Comparison with Standard MACD
| Feature | Standard MACD | ACCDv3 |
|---------|---------------|---------|
| **Input** | Close price | Accumulation/Distribution line |
| **Weighting** | Simple EMA | Volume-weighted EMA |
| **Divergence** | Price vs MACD | A/D vs MACD |
| **Volume Analysis** | None | Built-in strength filter |
| **Color System** | 2 colors (up/down) | 4+ colors (direction + volume) |
| **Leading/Lagging** | Lagging | More leading (volume-weighted) |
## Example Scenarios
### Scenario 1: Strong Bullish Signal
- **Chart**: MACD crosses above zero line
- **Histogram**: Dark green bars (#1B5E20) appearing
- **Volume**: Above 20-period average
- **Action**: Enter long, strong momentum with volume confirmation
### Scenario 2: Weak Bearish Signal
- **Chart**: MACD crosses below zero line
- **Histogram**: Light pink bars (#FFCDD2) appearing
- **Volume**: Below 20-period average
- **Action**: Avoid shorting, low volume = unreliable signal
### Scenario 3: Bullish Divergence Reversal
- **Chart**: Price making lower lows
- **Indicator**: A/D line trending up, MACD negative
- **Background**: Green shading appears
- **Histogram**: Transitions from red to dark green
- **Action**: Look for long entry on next dark green bar
### Scenario 4: V-Bottom Reversal
- **Chart**: Downtrend in place
- **Histogram**: Red bars start rising (becoming less negative)
- **Pattern**: Forms "V" shape at bottom
- **Confirmation**: Transitions to dark green bars
- **Action**: Bullish reversal signal, consider long entry
## Timeframe Recommendations
- **1-minute**: Scalping, very fast signals (noisy, use with caution)
- **5-minute**: Intraday momentum trading (recommended)
- **15-minute**: Swing entries, clearer trend signals
- **1-hour+**: Position trading, major trend identification
## Limitations
- **Requires volume data**: Will not work on instruments without volume
- **Lag during consolidation**: MACD is inherently trend-following
- **False signals in chop**: Sideways markets generate noise
- **Not a standalone system**: Should be combined with price action and risk management
## Version History
- **v3**: Removed traditional price MACD, using only volume-weighted A/D MACD with A/D divergence
- **v2**: Added A/D divergence detection, volume strength filtering, enhanced histogram colors
- **v1**: Basic MACD on A/D line with volume-weighted calculation
## Support & Further Reading
For questions, updates, or to report issues, refer to the main project documentation or contact the developer.
**Related Indicators in Suite:**
- **VMACDv3**: Volume-weighted MACD on price (not A/D)
- **RSIv2**: RSI with A/D divergence
- **DMI**: Directional Movement Index with A/D divergence
- **Elder Impulse**: Bar coloring system using volume-weighted MACD
---
*This indicator is for educational purposes. Always practice proper risk management and never risk more than you can afford to lose.*

ds-Volume with Flags & Alerts v1.2ds-Volume with Flags & Alerts: User & Training Guide
1. Summary of Features
This indicator is a powerful, all-in-one tool designed to give you a deep and customizable view of market volume. By analyzing volume in multiple ways, it helps you spot unusual activity, confirm trends, and identify potential reversals.
How It Helps a Trader:
Spotting Institutional Activity: The core purpose of the Volume Flags (using either the Multiplier or Standard Deviation method) is to highlight bars with exceptionally high volume. These spikes often signal the entry or exit of large institutional players. A high-volume up-bar can confirm bullish conviction, while a high-volume down-bar can signal significant selling pressure.
Identifying Climactic Events: The HVE (Highest Volume Ever) and HV1 (Highest Volume - 1 Year) labels automatically pinpoint the most significant volume events on the chart. A "blow-off top" at the end of a long uptrend or a "capitulation" event at a market bottom is almost always accompanied by an HVE or HV1 bar. These are critical moments to watch for potential trend reversals.
Gauging Buying vs. Selling Pressure: The Up/Down Volume Ratio gives you a more nuanced view than volume alone. A ratio consistently above 1.2 suggests that buyers are more aggressive, while a ratio below 0.8 suggests sellers are in control. Watching this ratio can help you confirm the strength of a trend or spot divergences where price is rising but the ratio is falling (a potential warning sign).
Visual Confirmation & Customization: With options to color both the volume bars and the main price bars, you can get instant visual confirmation of these events without having to look away from the price action. The ability to toggle features on and off keeps your chart clean and focused on what matters most to you.
Actionable Alerts: The comprehensive alert system ensures you don't miss a key event. You can be notified of everything from a new all-time high volume bar to a subtle shift in the Up/Down Volume Ratio, allowing you to react to market changes in real-time.
2. User-Changeable Options
This indicator is highly customizable. Here is a breakdown of every setting available in the "Inputs" tab.
General Settings
MA Length: The lookback period for the simple moving average (the gray area plot) of the volume.
Volume Flags
Color Price Bars with Flags: If checked, the main price bars on your chart will be colored when a high or low volume flag condition is met.
Color Volume Bars with Flags: If checked, the volume bars in the indicator pane will be colored for flag conditions.
Flag Calculation Method: This is a crucial setting.
Multiplier (Default): Identifies high volume based on a simple multiple of the average volume (e.g., volume is 1.4x its average). It's simple and intuitive.
Standard Deviation: Identifies high volume based on how statistically unusual it is compared to its recent behavior. This method is more adaptive to changing market volatility.
Daily/Weekly Lookback (Multiplier): Sets the lookback period for calculating the average volume when using the "Multiplier" method.
Daily/Weekly High-Vol Multiplier: Sets the multiplier for a high volume event (e.g., 1.4).
STDEV Length (Daily/Weekly): Sets the lookback period for calculating the average and standard deviation when using the "Standard Deviation" method.
STDEV Threshold (Daily/Weekly): Sets the number of standard deviations above the average required to trigger a high volume flag (e.g., 2.0).
Daily/Weekly Low-Vol Multiplier: Sets the threshold for a low volume event (e.g., 0.5 means volume is less than 50% of its average). This is always based on the multiplier method.
Ratios & Stats
Up/Down Ratio Daily/Weekly Lookback: Sets the lookback period for calculating the sum of up volume and down volume for the ratio.
Ratio Calculation Method:
Close vs. Open: Defines an "up volume" bar as one where the close is higher than the open.
Close vs. Previous Close (Default): Defines an "up volume" bar as one where the close is higher than the previous bar's close. This is a common standard.
Up Ratio Arrow Threshold: If the U/D Ratio exceeds this value, a green "up" arrow will appear.
Show Up Ratio Arrow: Toggles the visibility of the green "up" arrow.
Down Ratio Arrow Threshold: If the U/D Ratio falls below this value, a red "down" arrow will appear.
Show Down Ratio Arrow: Toggles the visibility of the red "down" arrow.

WhispererRealtimeVolumeLibrary "WhispererRealtimeVolume"
▮ Overview
The Whisperer Realtime Volume Library is a lightweight and reusable Pine Script® library designed for real-time volume analysis.
It calculates up, down, and neutral volumes dynamically, making it an essential tool for traders who want to gain deeper insights into market activity.
This library is a simplified and modular version of the original "Realtime Volume Bars w Market Buy/Sell/Neutral split & Mkt Delta" indicator by the_MarketWhisperer , tailored for integration into custom scripts.
How bars are classified
- Up Bars
If the current bar’s closing price is higher than the previous bar’s closing price, it is classified as an up bar.
Volume handling:
The increase in volume for this bar is added to the up volume.
This represents buying pressure.
- Down Bars
If the current bar’s closing price is lower than the previous bar’s closing price, it is classified as a down bar.
Volume handling:
The increase in volume for this bar is added to the down volume.
This represents selling pressure.
- Neutral Bars
If the current bar’s closing price is the same as the previous bar’s closing price, it is classified as a neutral bar.
Volume handling:
If neutral volume is enabled, the volume is added to the neutral volume.
If neutral volume is not enabled, the volume is assigned to the same direction as the previous bar (up or down). If the previous direction is unknown, it is added to the neutral volume.
▮ What to look for
Real-Time Volume Calculation : Analyze up, down, and neutral volumes in real-time based on price movements and bar volume.
Customizable Start Line : Add a visual reference line to your chart for better context by viewing the starting point of real-time bars.
Ease of Integration : Designed as a library for seamless use in other Pine Script® indicators or strategies.
▮ How to use
Example code:
//@version=6
indicator("Volume Realtime from Whisperer")
import andre_007/WhispererRealtimeVolume/4 as MW
MW.displayStartLine(startLineColor = color.gray, startLineWidth = 1, startLineStyle = line.style_dashed,
displayStartLine = true, y1=volume, y2=volume + 10)
= MW.mw_upDownVolumeRealtime(true)
plot(volume, style=plot.style_columns, color=color.gray)
plot(volumeUp, style=plot.style_columns, color=color.green)
plot(volumeDown, style=plot.style_columns, color=color.red)
plot(volumeNeutral, style=plot.style_columns, color=color.purple)
▮ Credits
This library is inspired by the original work of the_MarketWhisperer , whose "Realtime Volume Bars" indicator served as the foundation.
Link to original indicator :

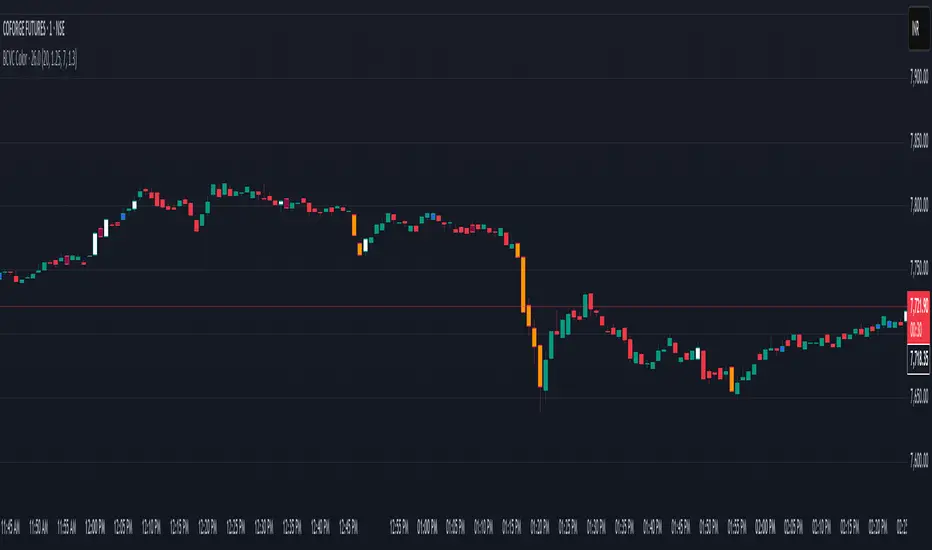
BCVC - Volume & Big Candle ColorThe BCVC (Volume & Big Candle Color) indicator helps traders identify significant price movements accompanied by unusual volume activity. By dynamically coloring bars based on volume spikes and candle size, it highlights potential momentum shifts, breakouts, or reversals. This tool is ideal for traders who want to:
Spot institutional buying/selling activity.
Confirm trend strength using volume and price volatility.
Filter noise by focusing on high-impact bars.
Key Features
Volume Spike Detection:
Compares current volume to a moving average (EMA) of volume.
Highlights bars where volume exceeds the average by a user-defined multiplier.
Big Candle Detection:
Identifies bars with a range (high-low) larger than the historical average range (EMA of candle ranges).
Thresholds for "big candles" are customizable.
Color-Coded Logic:
White Bars: High volume + Big candle + Bullish (close > open).
Orange Bars: High volume + Big candle + Bearish (close < open).
Blue Bars: High volume + Regular candle + Bullish.
Maroon Bars: High volume + Regular candle + Bearish.
Input Parameters
Volume Settings:
Volume Period: EMA length for average volume calculation (default: 20).
Volume Multiplier: Threshold multiplier for volume spikes (e.g., 1.25 = 25% above average).
Candle Size Settings:
Lookback Period: EMA length for average candle range (default: 7).
Big Candle Multiplier: Threshold multiplier for large candles (e.g., 1.3 = 30% above average range).
How It Works
Volume Analysis:
The indicator calculates an EMA of volume over the specified period.
If the current bar’s volume exceeds Average Volume × Volume Multiplier, it’s flagged as a high-volume bar.
Candle Range Analysis:
The average candle range (high-low) is calculated using an EMA over the lookback period.
A "big candle" is identified when the current bar’s range exceeds Average Range × Big Candle Multiplier.
Combined Signals:
High-volume bars are colored based on whether they are bullish/bearish and whether their range exceeds the big-candle threshold.
Example: A white bar (high volume + big candle + bullish) suggests strong buying pressure with institutional participation.
Usage Scenarios
Breakout Confirmation: A white/orange bar at a support/resistance level may validate a breakout.
Reversal Signals: A maroon/orange bar after a long trend could indicate exhaustion and potential reversal.
Trend Strength: Clusters of blue/white bars during uptrends (or maroon/orange in downtrends) confirm momentum.
Benefits
Visual Clarity: Instantly spot high-impact bars without manually scanning volume or candle size.
Customizable Sensitivity: Adjust multipliers to filter noise (e.g., increase for fewer signals).
Universal Application: Works on all timeframes and instruments (stocks, forex, crypto).
Notes
Best Paired With: Trendlines, support/resistance levels, or momentum oscillators (e.g., RSI).
Avoid False Signals: Use higher multipliers (e.g., 1.5) on lower timeframes to reduce noise.
Dix$on's Weighted Volume FlowDixson's Weighted Volume Flow
Dixson's Weighted Volume Flow is a technical indicator designed to analyze and visualize the distribution of buy and sell volume within a given timeframe. It dynamically calculates the proportional allocation of volume based on price action within each bar, providing insights into market sentiment and activity. This indicator displays horizontal volume bars in a separate pane and annotates them with precise volume values.
How It Works
1. Volume Allocation:
- The indicator calculates buy and sell volume using the following formulas:
- Buy Volume = (Close - Low) / (High - Low) Total Volume
- Sell Volume = (High - Close) / (High - Low) Total Volume
- These formulas allocate volume proportionally based on the bar's price range, attributing more volume to buying or selling depending on the relationship between the close, high, and low prices.
2. Dynamic Scaling:
- The buy and sell volumes are scaled relative to their combined total for the period.
- The resulting values determine the length of the horizontal bars, providing a comparative view of buy and sell activity.
3. Bar Visualization:
- Buy Volume Bars: Displayed as green horizontal bars.
- Sell Volume Bars: Displayed as red horizontal bars.
- The lengths of the bars represent the dominance of buy or sell volume, scaled dynamically within the pane.
4. Labels:
- Each bar is annotated with a label showing its calculated buy or sell volume value.
5. Timeframe Adjustment:
- The indicator uses the request.security() function to fetch data from the selected timeframe, allowing users to customize their analysis for intraday, daily, or longer-term trends.
6. Customization Options:
- Enable or disable the indicator using a toggle.
- Adjust colors for the buy/sell bars and text labels to suit your chart theme.
How to Use It
1. Enable the Indicator:
- Activate the indicator using the "Enable/Disable" toggle in the settings.
2. Select a Timeframe:
- Choose the timeframe for analysis (e.g., 1-minute, 1-hour, daily). The indicator fetches volume data specific to the selected timeframe.
3. Interpret the Visualization:
- Compare Bar Lengths:
- Longer buy volume bars (green) indicate stronger buying activity.
- Longer sell volume bars (red) suggest dominant selling pressure.
- Labels:
- Use the labels to view the exact buy and sell volume values for precise analysis.
4. Combine with Other Tools:
- Use the indicator alongside price action analysis, support/resistance levels, or trend indicators to confirm market sentiment and detect potential reversals.
5. Monitor Imbalances:
- Significant disparities between buy and sell volume can signal shifts in market sentiment, such as the end of a trend or the start of a breakout.
Practical Applications
- Trend Confirmation:
- Align the dominance of buy or sell volume with price trends to confirm market direction.
- Reversal Signals:
- Watch for volume imbalances or a sudden shift in the dominance of buy or sell volume to identify potential reversals.
- High-Activity Zones:
- Identify areas with increased volume to anticipate significant price movements or key support/resistance interactions.
Dixson's Weighted Volume Flow provides a clear and systematic way to analyze market activity by visualizing the dynamics of buy and sell volume. It is particularly useful for traders looking to enhance their understanding of volume-based sentiment and its impact on price movements.

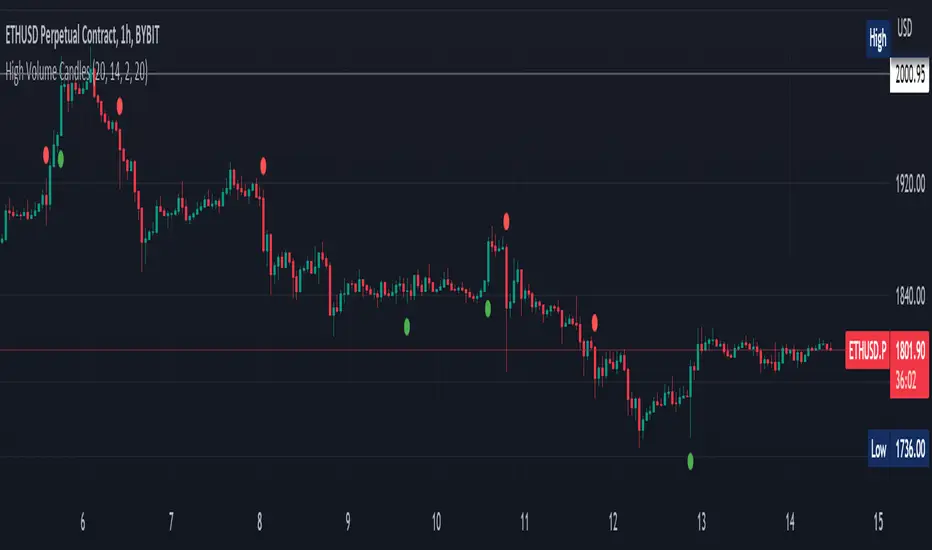
High Volume Candles Detector - Open Source CodeGreetings, fellow traders!
Throughout my trading career, I've been intrigued by the dynamic interplay between candlestick patterns and trading volume. This fascination led me to develop an open-source indicator to help illuminate these patterns for the broader trading community.
Upon researching the Public Library, I found that many indicators relating to candlestick/volume analysis are proprietary and not open-source. This discovery further fueled my commitment to contribute a free, accessible tool that traders of all levels can utilize in their technical analysis.
Thus, I am excited to present to you our High Volume Bars Indicator. A unique tool that I believe fills a gap in the Public Library. I truly hope you find it beneficial in your trading journey and that it empowers you to make more informed decisions.
Description:
The High Volume Bars Detector is designed to help traders identify bars with significantly higher volume than the average. Users can filter in the settings menu:
1) The length of the Simple Moving Average (SMA) for volume, allowing you to define the average volume over a specific number of bars.
2) The Volume Multiplier, a factor that determines how much greater the volume of a bar should be compared to the SMA to qualify as a high-volume bar.
3) The Lookback Period, a specified number of candles used as a comparative benchmark for identifying the highest volume.
4) If the Volume bar is green or red, so if the candle price is --> close > open or open > close
Examples to better understand the logic of the indicator:
1) Length of the Simple Moving Average (SMA) for Volume: This setting allows you to define the average volume over a specific number of bars. For instance, if you set the SMA length to 20, the indicator will calculate the average volume of the past 20 bars and use it as a baseline to identify high volume bars.
2) Volume Multiplier: This is a critical factor that determines the threshold for what constitutes a high-volume bar. If you set the volume multiplier to 2.0, for example, the indicator will flag any bar where the volume is twice the value of the SMA volume as a high-volume bar.
3) Lookback Period: This setting lets you specify the number of candles that the indicator should consider when determining the highest volume. For instance, if the lookback period is set to 14, the indicator will compare the volume of the current bar with the volumes of the previous 14 bars. If the current bar's volume is the highest, it will be flagged.
4) Volume Bar Color: This filter helps you identify whether a high-volume bar is bullish or bearish. If the bar is green (close > open), it suggests buyers were dominant during that period. If the bar is red (open > close), it suggests sellers had the upper hand. By setting this filter, you can choose to focus on high volume bars that are either bullish (green) or bearish (red) or both, depending on your trading strategy.
Remember, these filters offer a level of customization that allows you to tailor the High Volume Bars Detector to your unique trading style and requirements. Always remember to adapt these settings to align with your overall trading plan and risk tolerance.
Keep attention!
It is important to note that no trading indicator or strategy is foolproof, and there is always a risk of losses in trading. While this indicator may provide useful information for making conclusions, it should not be used as the sole basis for making trading decisions. Traders should always use proper risk management techniques and consider multiple factors when making trading decisions.
Support me:)
If you find this new indicator helpful in your trading analysis, I would greatly appreciate your support! Please consider giving it a like, leaving feedback, or sharing it with your trading network. Your engagement will not only help me improve this tool but will also help other traders discover it and benefit from its features. Thank you for your support!
VRVP Clone + Multi-POC -- PerroGordoVRVP Clone + Multi-POC
Overview
VRVP Clone + Multi-POC replicates TradingView's native Visible Range Volume Profile with several practical enhancements. The indicator displays volume distribution across price levels for the visible chart range, which is useful for identifying high-volume nodes, support/resistance zones, and areas of price acceptance.
The main differentiator from the built-in VRVP is support for multiple Point of Control (POC) lines with an intelligent peak detection algorithm. Instead of just showing the single highest-volume level, you can identify distinct volume clusters across different price zones.
Features
Dynamic Visible Range
Recalculates automatically on scroll or zoom
Analyzes only visible bars
Profile width scales proportionally to view
Multiple POC Detection (1-8 levels)
Volume Nodes Mode: Peak detection algorithm finds local volume maxima across distinct price clusters
Highest Rows Mode: Traditional approach - top N rows by raw volume
Configurable minimum separation between nodes to prevent bunching
Individual colors for each POC level
Volume Display Modes
Up/Down: Split bars showing buy vs. sell volume with black outlines for visual separation
Total: Single bar colored by dominant direction
Delta: Net volume (buy minus sell)
Delta Intensity: Gradient coloring indicating buyer/seller dominance strength per row
Value Area
Configurable percentage (default 70%)
VAH and VAL lines with customizable styles
Separate colors for volume inside vs. outside the Value Area
Positioning Options
Left or Right placement
Adjustable profile width as percentage of visible range
Row configuration via "Number of Rows" or "Ticks Per Row"
Additional Features
Statistics table showing bars analyzed, total volume, up/down percentages, price vs POC
POC price labels on chart
Line style options (Solid, Dashed, Dotted)
+++++
How It Works
Volume from each bar is distributed across price rows based on the bar's high-low range. The allocation is proportional - if a bar spans 3 rows with 60% overlap on one row, that row receives 60% of the bar's volume.
Volume Nodes Mode identifies local peaks in the distribution (rows where volume exceeds both neighbors), then selects the highest peaks while enforcing minimum separation. This surfaces distinct support/resistance clusters rather than stacking all POC lines in a single high-volume area.
+++++
Settings
Inputs
Setting - Description
Rows Layout - "Number of Rows" or "Ticks Per Row"
Row Size - Number of rows (24-200) or ticks per row
Volume - "Up/Down", "Total", "Delta", or source selection
Value Area % - Percentage of volume for Value Area (default 70%)
Profile Width % - Width as percentage of visible bars
Placement - "Right" or "Left" side of chart
Enhancements
Setting - Description
Number of POCs | 1-8 POC lines |
POC Mode - "Volume Nodes" (peak detection) or "Highest Rows" (traditional)
Min Node Separation - Minimum rows between nodes (0 = auto-calculate)
Delta Intensity Mode - Gradient coloring by dominance
Show Stats Table - Display analysis statistics
Style
Setting - Description
Up/Down Volume Colors - Buy/sell volume colors
Value Area Colors - Colors for VA regions
POC/VAH/VAL Colors - Line colors and styles
POC 2-8 Colors - Colors for additional POC levels
+++++
Applications
Support/Resistance Identification
High-volume nodes tend to act as price magnets. Multiple POCs reveal layered S/R zones that aren't visible with a single POC.
Fair Value Reference
The Value Area represents where 70% of volume traded. Price tends to revert to this zone.
Volume Gap Analysis
Low-volume areas between POCs indicate prices that were rejected quickly - potential breakout or breakdown levels.
Market Structure
Multiple POCs across price levels show where the market has found acceptance, useful for distinguishing range-bound conditions from trending moves.
+++++
Practical Notes
Volume Nodes mode with 3-5 POCs works well for identifying distinct S/R clusters
Higher row counts give more granular analysis on lower timeframes
Delta Intensity mode quickly shows buyer/seller dominance at each level without the visual noise of split bars
If POCs are too clustered, increase Min Node Separation; if too spread out, decrease it or set to 0 for auto
The stats table vs POC comparison is useful for quick directional bias assessment
+++++
Requirements
Any instrument with volume data
Works well on futures, forex, and liquid equities
Pine Script v6
+++++
Version History
v1.1
- Added Volume Nodes mode with peak detection
- Expanded to 8 POC levels
- Added Min Node Separation setting
- Fixed POC label positioning for left placement
- Added black outlines to Up/Down volume bars
v1.0
- Initial release replicating VRVP with multi-POC enhancement
- Delta Intensity mode
- Statistics table

BOCS AdaptiveBOCS Adaptive Strategy - Automated Volatility Breakout System
WHAT THIS STRATEGY DOES:
This is an automated trading strategy that detects consolidation patterns through volatility analysis and executes trades when price breaks out of these channels. Take-profit and stop-loss levels are calculated dynamically using Average True Range (ATR) to adapt to current market volatility. The strategy closes positions partially at the first profit target and exits the remainder at the second target or stop loss.
TECHNICAL METHODOLOGY:
Price Normalization Process:
The strategy begins by normalizing price to create a consistent measurement scale. It calculates the highest high and lowest low over a user-defined lookback period (default 100 bars). The current close price is then normalized using the formula: (close - lowest_low) / (highest_high - lowest_low). This produces values between 0 and 1, allowing volatility analysis to work consistently across different instruments and price levels.
Volatility Detection:
A 14-period standard deviation is applied to the normalized price series. Standard deviation measures how much prices deviate from their average - higher values indicate volatility expansion, lower values indicate consolidation. The strategy uses ta.highestbars() and ta.lowestbars() functions to track when volatility reaches peaks and troughs over the detection length period (default 14 bars).
Channel Formation Logic:
When volatility crosses from a high level to a low level, this signals the beginning of a consolidation phase. The strategy records this moment using ta.crossover(upper, lower) and begins tracking the highest and lowest prices during the consolidation. These become the channel boundaries. The duration between the crossover and current bar must exceed 10 bars minimum to avoid false channels from brief volatility spikes. Channels are drawn using box objects with the recorded high/low boundaries.
Breakout Signal Generation:
Two detection modes are available:
Strong Closes Mode (default): Breakout occurs when the candle body midpoint math.avg(close, open) exceeds the channel boundary. This filters out wick-only breaks.
Any Touch Mode: Breakout occurs when the close price exceeds the boundary.
When price closes above the upper channel boundary, a bullish breakout signal generates. When price closes below the lower boundary, a bearish breakout signal generates. The channel is then removed from the chart.
ATR-Based Risk Management:
The strategy uses request.security() to fetch ATR values from a specified timeframe, which can differ from the chart timeframe. For example, on a 5-minute chart, you can use 1-minute ATR for more responsive calculations. The ATR is calculated using ta.atr(length) with a user-defined period (default 14).
Exit levels are calculated at the moment of breakout:
Long Entry Price = Upper channel boundary
Long TP1 = Entry + (ATR × TP1 Multiplier)
Long TP2 = Entry + (ATR × TP2 Multiplier)
Long SL = Entry - (ATR × SL Multiplier)
For short trades, the calculation inverts:
Short Entry Price = Lower channel boundary
Short TP1 = Entry - (ATR × TP1 Multiplier)
Short TP2 = Entry - (ATR × TP2 Multiplier)
Short SL = Entry + (ATR × SL Multiplier)
Trade Execution Logic:
When a breakout occurs, the strategy checks if trading hours filter is satisfied (if enabled) and if position size equals zero (no existing position). If volume confirmation is enabled, it also verifies that current volume exceeds 1.2 times the 20-period simple moving average.
If all conditions are met:
strategy.entry() opens a position using the user-defined number of contracts
strategy.exit() immediately places a stop loss order
The code monitors price against TP1 and TP2 levels on each bar
When price reaches TP1, strategy.close() closes the specified number of contracts (e.g., if you enter with 3 contracts and set TP1 close to 1, it closes 1 contract). When price reaches TP2, it closes all remaining contracts. If stop loss is hit first, the entire position exits via the strategy.exit() order.
Volume Analysis System:
The strategy uses ta.requestUpAndDownVolume(timeframe) to fetch up volume, down volume, and volume delta from a specified timeframe. Three display modes are available:
Volume Mode: Shows total volume as bars scaled relative to the 20-period average
Comparison Mode: Shows up volume and down volume as separate bars above/below the channel midline
Delta Mode: Shows net volume delta (up volume - down volume) as bars, positive values above midline, negative below
The volume confirmation logic compares breakout bar volume to the 20-period SMA. If volume ÷ average > 1.2, the breakout is classified as "confirmed." When volume confirmation is enabled in settings, only confirmed breakouts generate trades.
INPUT PARAMETERS:
Strategy Settings:
Number of Contracts: Fixed quantity to trade per signal (1-1000)
Require Volume Confirmation: Toggle to only trade signals with volume >120% of average
TP1 Close Contracts: Exact number of contracts to close at first target (1-1000)
Use Trading Hours Filter: Toggle to restrict trading to specified session
Trading Hours: Session input in HHMM-HHMM format (e.g., "0930-1600")
Main Settings:
Normalization Length: Lookback bars for high/low calculation (1-500, default 100)
Box Detection Length: Period for volatility peak/trough detection (1-100, default 14)
Strong Closes Only: Toggle between body midpoint vs close price for breakout detection
Nested Channels: Allow multiple overlapping channels vs single channel at a time
ATR TP/SL Settings:
ATR Timeframe: Source timeframe for ATR calculation (1, 5, 15, 60, etc.)
ATR Length: Smoothing period for ATR (1-100, default 14)
Take Profit 1 Multiplier: Distance from entry as multiple of ATR (0.1-10.0, default 2.0)
Take Profit 2 Multiplier: Distance from entry as multiple of ATR (0.1-10.0, default 3.0)
Stop Loss Multiplier: Distance from entry as multiple of ATR (0.1-10.0, default 1.0)
Enable Take Profit 2: Toggle second profit target on/off
VISUAL INDICATORS:
Channel boxes with semi-transparent fill showing consolidation zones
Green/red colored zones at channel boundaries indicating breakout areas
Volume bars displayed within channels using selected mode
TP/SL lines with labels showing both price level and distance in points
Entry signals marked with up/down triangles at breakout price
Strategy status table showing position, contracts, P&L, ATR values, and volume confirmation status
HOW TO USE:
For 2-Minute Scalping:
Set ATR Timeframe to "1" (1-minute), ATR Length to 12, TP1 Multiplier to 2.0, TP2 Multiplier to 3.0, SL Multiplier to 1.5. Enable volume confirmation and strong closes only. Use trading hours filter to avoid low-volume periods.
For 5-15 Minute Day Trading:
Set ATR Timeframe to match chart or use 5-minute, ATR Length to 14, TP1 Multiplier to 2.0, TP2 Multiplier to 3.5, SL Multiplier to 1.2. Volume confirmation recommended but optional.
For Hourly+ Swing Trading:
Set ATR Timeframe to 15-30 minute, ATR Length to 14-21, TP1 Multiplier to 2.5, TP2 Multiplier to 4.0, SL Multiplier to 1.5. Volume confirmation optional, nested channels can be enabled for multiple setups.
BACKTEST CONSIDERATIONS:
Strategy performs best during trending or volatility expansion phases
Consolidation-heavy or choppy markets produce more false signals
Shorter timeframes require wider stop loss multipliers due to noise
Commission and slippage significantly impact performance on sub-5-minute charts
Volume confirmation generally improves win rate but reduces trade frequency
ATR multipliers should be optimized for specific instrument characteristics
COMPATIBLE MARKETS:
Works on any instrument with price and volume data including forex pairs, stock indices, individual stocks, cryptocurrency, commodities, and futures contracts. Requires TradingView data feed that includes volume for volume confirmation features to function.
KNOWN LIMITATIONS:
Stop losses execute via strategy.exit() and may not fill at exact levels during gaps or extreme volatility
request.security() on lower timeframes requires higher-tier TradingView subscription
False breakouts inherent to breakout strategies cannot be completely eliminated
Performance varies significantly based on market regime (trending vs ranging)
Partial closing logic requires sufficient position size relative to TP1 close contracts setting
RISK DISCLOSURE:
Trading involves substantial risk of loss. Past performance of this or any strategy does not guarantee future results. This strategy is provided for educational purposes and automated backtesting. Thoroughly test on historical data and paper trade before risking real capital. Market conditions change and strategies that worked historically may fail in the future. Use appropriate position sizing and never risk more than you can afford to lose. Consider consulting a licensed financial advisor before making trading decisions.
ACKNOWLEDGMENT & CREDITS:
This strategy is built upon the channel detection methodology created by AlgoAlpha in the "Smart Money Breakout Channels" indicator. Full credit and appreciation to AlgoAlpha for pioneering the normalized volatility approach to identifying consolidation patterns and sharing this innovative technique with the TradingView community. The enhancements added to the original concept include automated trade execution, multi-timeframe ATR-based risk management, partial position closing by contract count, volume confirmation filtering, and real-time position monitoring.

Enhanced VSA Volume & Candle Colors with MA SelectionOverview:
This script aims to enhance the visualization of volume spikes and price action by coloring volume bars and price candles dynamically based on the volume behavior. It allows traders to customize the type of volume moving average (SMA, EMA, or VWMA) used and apply various color schemes to highlight high, low, and extreme volume conditions. Additionally, alerts are generated when extreme or low-volume conditions occur.
---------------------------------------------------------------------------------------------------------------------
Key Features:
Customizable Volume Lookback Period:
The script allows users to define the period for calculating the moving average of volume (default: 200).
Volume Multiplier Settings:
High and low volume thresholds are defined using multipliers. Users can adjust these to customize how volume is categorized (default multipliers: 1.5 for high volume, 0.5 for low volume).
Percentile-Based Extreme Volume Detection:
The script calculates a percentile threshold for extreme volume (default: 90th percentile) based on the volume data, highlighting exceptionally high volume spikes.
Moving Average Selection:
Users can choose between Simple Moving Average (SMA), Exponential Moving Average (EMA), or Volume Weighted Moving Average (VWMA) to track volume trends over the selected lookback period.
Volume-Based Price Bar Coloring:
Price bars can be colored according to the volume conditions (high, low, or extreme). This feature can be toggled on or off.
Dynamic Transparency and Color Customization:
The script allows users to set custom colors for different volume conditions (high, low, neutral, extreme) and adjusts the transparency of volume bars based on the relative size of the volume.
Alerts:
Alerts can be set for when extreme volume spikes or low volume conditions are detected.
---------------------------------------------------------------------------------------------------------------------
Script Components:
Volume Histogram Plot:
Displays the volume bars with dynamic coloring based on the volume condition (high, low, or extreme). The color of the bars adjusts for clarity, with transparency based on volume levels.
Moving Average Plot:
Plots the selected volume moving average (SMA, EMA, or VWMA) to visualize the trend of volume over the chosen lookback period.
Smoothed Average Volume (EMA of Volume):
A smoothed EMA line is plotted to provide a clear representation of volume trends over time.
Price Bar Coloring:
If enabled, price bars are colored according to the current volume condition, providing immediate visual feedback to the trader.
---------------------------------------------------------------------------------------------------------------------
How It Can Be Used:
Volume Analysis for Entry/Exit Points: Traders can use the volume conditions (high, low, and extreme) to identify potential entry or exit points. High-volume bars often signal strong market activity, while low-volume bars may indicate consolidation or indecision.
Volume Confirmation for Trend Reversal: Extreme volume spikes can sometimes precede significant price movements. Traders can monitor these spikes for potential trend reversal signals.
Customizing Alerts: Alerts based on volume conditions help traders stay updated on important volume events without constantly monitoring the chart.
Color-Coded Price Action: The dynamic coloring of price bars makes it easier to identify periods of strong or weak market participation, allowing traders to make informed decisions quickly.
---------------------------------------------------------------------------------------------------------------------
Compliance with TradingView's House Rules:
No Promotion of Financial Products: The script does not promote any specific financial instruments or products, ensuring compliance with TradingView’s content guidelines.
Clear Functionality: The script provides clear, functional analysis tools without making unsupported claims about predicting market movements.
No Automated Trading: The script does not include any automated trading or order execution features, which complies with TradingView’s policy on non-automated scripts.
This breakdown ensures clarity on the script’s purpose, features, and how it might be used by traders. It's written in a way that fits TradingView's content guidelines, keeping the focus on providing valuable analytical tools rather than making promises or promoting any financial product.
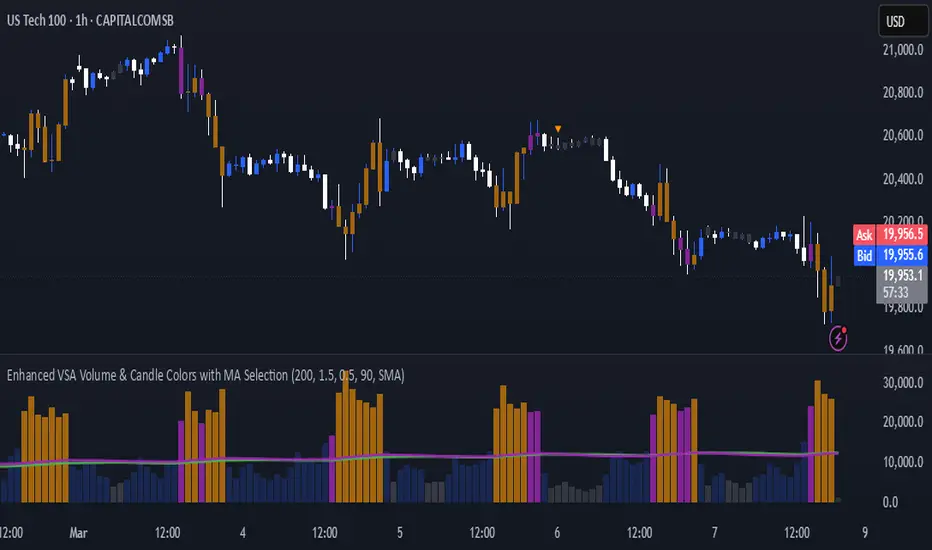
Custom Volume for scalping### **Indicator Summary: Custom Volume with Arrow Highlight**
#### **Purpose:**
This indicator visualizes volume bars in a chart, highlighting specific conditions based on volume trends. It displays arrows above the volume bars to indicate potential bullish or bearish market conditions.
#### **Key Features:**
1. **Volume Bars**:
- The indicator plots volume as columns on the chart.
- Volume bars are colored:
- **White** for bullish volume (when the closing price is higher than the opening price).
- **Blue** for bearish volume (when the closing price is lower than the opening price).
2. **Highlight Conditions**:
- The indicator identifies a sequence of three consecutive volume bars:
- The first two bars must be of the same direction (either both bullish or both bearish).
- The third bar must be of the opposite direction.
- Additionally, the third bar's volume must be greater than the previous bar's volume.
3. **Arrow Indicators**:
- When the highlight conditions are met:
- An **upward arrow** ("▲") is placed above the third volume bar for bullish conditions (when the third bar is bullish).
- A **downward arrow** ("▼") is placed above the third volume bar for bearish conditions (when the third bar is bearish).
- The arrows are colored to match the respective volume bar: white for bullish and blue for bearish.
4. **Adjustable Size**:
- The arrows are sized appropriately to ensure visibility without cluttering the chart.
#### **Use Cases:**
- This indicator can help traders identify potential reversals or continuation patterns based on volume behavior.
- It is particularly useful for traders focusing on volume analysis to confirm market trends and make informed trading decisions.
#### **Customization:**
- Users can modify the conditions and visual attributes according to their preferences, such as changing colors, sizes, and label positions.
### **Conclusion:**
The "Custom Volume with Arrow Highlight" indicator provides a straightforward and effective way to visualize volume trends and identify key market conditions, aiding traders in their decision-making processes. It combines the power of volume analysis with clear visual cues, making it a valuable tool for technical analysis in trading.
If you need any further modifications or details, let me know!

Bullish/Bearish Volume Indicator ABDJO1- red bars are bearish volume
2- yellow bars are a weakness of bearish volume.
3-green bars are a strong bullish volume.
4-Orange bars are a weakness of bullish volume.
1. Price Movements
The chart does not explicitly show price movements, but the volume bars can give us indirect clues. Typically, a transition from green (strong bullish volume) to red (bearish volume) suggests a potential reversal from an uptrend to a downtrend. The presence of orange bars (weakness of bullish volume) following green bars indicates a decrease in buying momentum, which often precedes a price decline.
2. Trading Volume
Green Bars: Represent strong bullish volume, indicating strong buying interest.
Orange Bars: Indicate a weakening of bullish volume, suggesting that buyers are losing strength or interest at higher price levels.
Yellow Bars: Represent a weakening of bearish volume, which could indicate that selling pressure is decreasing and a potential reversal or stabilization in price might occur.
Red Bars: Signify strong bearish volume, indicating strong selling pressure.
3. Price-Volume Relationship
The transition from green to orange and then to red bars shows a typical pattern where initial strong buying interest (green) is followed by a decrease in buyer enthusiasm (orange), and eventually overtaken by sellers (red). This pattern often corresponds to a peak in prices followed by a reversal to the downside.
4. Technical Indicators
Without specific price data, traditional indicators like MA (Moving Averages), MACD (Moving Average Convergence Divergence), or KDJ (Stochastic Oscillator) cannot be calculated directly. However, the volume pattern itself can be used as a rudimentary momentum indicator, with decreasing bullish volume (orange) and increasing bearish volume (red) suggesting a bearish momentum.
5. Support and Resistance Levels
Support Level: Could be hypothesized near the transition point from yellow to green bars, where buyers previously started to overpower sellers.
Resistance Level: Likely near the transition from green to orange bars, where sellers begin to regain control and buying momentum fades.
6. Overall Trend Patterns
The overall trend, inferred from the volume bars, suggests a bullish phase losing momentum and transitioning into a bearish phase. This is typical of a market top where buying interest wanes and sellers begin to dominate.
7. Future Projections and Recommendations
Given the observed shift from bullish to bearish volume, there is a higher likelihood of a downward price movement in the near term. Investors should consider this a potential sell signal, especially as bearish volume (red bars) increases. Caution is advised for buyers, and it might be prudent for holders to take profits or set stop-loss orders to protect against potential declines.

Ultimate VolumeThis script can display a lot of different volume statistics. It also colours bars depending on a chosen, customisable criterion. Most options are disabled by default and can be reenabled in the settings menu.
FAQ
Why are the bars slightly higher than the default volume bars?
Due to the limitations of Pinescript.
What are the two last values (including the one in white?)
They're there due to the limitations of Pinescript. It used to be possible to prevent certain values from being plotted, but still display them as indicator values, but the functionality of that option was changed and is now WIP so until it's restored, these values are necessary to scale the bars properly.
Why are the percentages formatted as volume?
Due to the limitations of Pinescript.
Why are there so many options?
I don't know. They sort of happened. But you don't have to switch them on.
What is money volume?
It's an average of the bar price multiplied by the bar volume .
Why does the daily average volume display different values than the standard sma volume?
Because mine doesn't take into account the current day. So it doesn't fluctuate intraday. Which, I think, makes more sense.
What is total volume?
It's a sum of the total volume for that day and is reset on the next. This option only works with intraday timeframes.
What is average 1 bar intraday volume?
It's the average volume for 1 intraday bar, based on the current day's values only. Obviously, it only works intraday and changes dynamically. It's not an SMA , it's a simple average of all bars for a given day.
What is all-time 1 bar intraday volume?
It's the average volume for 1 intraday bar, but based on the whole chart's history. It's impossible to select a length for this, again, because of certain limitations.
What is short volume?
It is approximately 1/3rd of the actual short volume , due to the limitations of FINRA. It's multiplied by 3 in the script and it may be not entirely accurate. The short volume % is calculated differently, using the 1/3rd of short and total volume from FINRA.
What are the default threshold values?
They are 150%, 200%, 1000% of the average for the average bar volume and all-time average bar volume options, 10%, 50%, 100% for the average daily volume option and 100K, 500K and 1M for the volume option.

RedK_Supply/Demand Volume Viewer v1Background
============
VolumeViewer is a volume indicator, that offers a simple way to estimate the movement and balance (or lack of) of supply & demand volume based on the shape of the price bar. i put this together few years ago and i have a version of this published for another platform under different names (Directional Volume, BetterVolume) in case you come across them
what is V.Viewer
=====================
The idea here is to find a "simple proxy" for estimating the demand or supply portions of a volume bar - these 2 forces have the potential to affect the current price trend so we want an easy way to track them - or to understand if a stock is in accumulation or distribution - we want to do this without having access to Level II or bid/ask data, and without having to get into the complexity of exploring the lower timeframe price & volume data
- to achieve that, we depend on a simple assumption, that the volume associated with an up move is "demand" and the volume associated with a down move is "Supply". so we basically extrapolate these supply and demand values based on how the bar looks like - a full "green" price bar / candle will be considered 100% demand, and a full "red" price bar will be considered 100% supply - a bar that opens and closes at the same level will be 50/50 split between supply & demand.
- you may say this is a "too simple" of an assumption to make, but believe me, it works :) at least at the basic scenario we need here: i'm just exploring the volume movement and finding key levels - and it provides a good improvement compared to the classic way we see volume on a chart - which is still available here in VolumeViewer.
in all cases, i consider this to be work in progress, so i'd welcome any ideas to improve (without getting too complicated) - there's already a host of great volume-based indicators that will do the multi timeframe drill down, but that's not my scope here.
Technical Jargon & calculation
===========================
1. first we calculate a score % for the volume portion that is considered demand based on the bar shape
skip this part if it sounds too technical => if you're into coding indicators, you would probably know there are couple of different concepts for that algorithm - for example, the one used in Balance Of Power formula - which i'm a big fan of - but the one i use here is different. (how?) this is my own, ant it simply applies double weight for the "wick" parts of a price bar compared to the "body of the bar" -- i did some side-by-side comparison in past and decided this one works better. you can change it in the code if you like
2. after calculating the Bull vs Bears portion of volume, we take a moving average of both for the length you set, to come up with what we consider to be the Demand vs Supply - as usual, i use a weighted moving average (WMA) here.
3. the balance or net volume between these 2 lines is calculated, then we apply a final smoothing and that's the main plot we will get
4. being a very visual person, i did my best to build up the visuals in the correct order - then also to ensure the "study title" bar is properly organized and is simple and useful (Full Volume, Supply, Demand, Net Volume).
- i wish there was a way in Pine to hide a value that i still need to visually plot but don't want it showing its value on the study title bar, but couldn't find it. so the last plot value is repeated twice.
How to use
===========
- V.Viewer is set up to show the simplified view by default for simplicity. so when you first add it to a chart, you will get only the supply vs demand view you can see in the middle pane in the above chart
- Optional / detailed mode: go into the settings, and expose all other plots, you will be able to add the classic volume histogram, and the Supply / Demand lines - note these 2 lines will be overlay-ed on top of each other - this provides an easy way to see who is in control - especially if you change the display of these 2 lines into "area" style. This is what is showing in the lower pane in the above chart.
** Exploring Key Price Levels
- the premise is, at spots where there's big lack of balance, that's where to expect to find key price levels (support / resistance) and these price levels will come into play in future so can be used to set entry / exit targets for our trades - see the example in the AAPL chart where you can easily locate these "balance or reversal levels" using the tops/bottoms/zero-crossings from the Net Volume line
** Use for longer-term Price Analysis
- we can also use this simple indicator to gain more insights (at a high level) of the price in terms of accumulation vs distribution and if the sellers or buyers are in control - for example, in the above AAPL chart, V.Viewer tells us that buyers have been in control since October 19 - even during the recent drop, demand continued to be in play - compare that to DIS chart below for the same period, where it shows that the market was dumping DIS thru the weakness. DIS was bleeding red most of the time
Final thoughts
=============
- V.Viewer is an attempt to enhance the way we see and use Volume by leveraging the shape of the price bar to estimate volume supply & demand - and the Net between the 2
- it will work for stocks and other instruments as long as there's volume data
- note that V.Viewer does not track trend. each bar is taken in isolation of prior bars - the price may be going down and V.Viewer is showing supply going up (absorption scenario?) - so i suggest you do not use it to make decisions without consulting other trend / momentum indicators - of course this is a possible improvement idea, or can be implemented in another indicator, add in trend somehow, or maybe think of making this a +100 / -100 Oscillator .. feel free to play with these thoughts
- all thoughts welcome - if this is useful to you in your trading, please share with other trades here to learn from each other
- the code is commented - please feel free to use it as you like, or build things on top of it - but please continue to credit the author of this code :)
good luck!
-

ICT HTF Volume Candles (Based on HTF Candles by Fadi)# ICT HTF Volume Candles - Multi-Timeframe Volume Analysis
## Overview
This indicator provides multi-timeframe volume visualization designed to complement price action analysis. It displays volume data from up to 6 higher timeframes simultaneously in a separate panel, allowing traders to identify volume spikes, divergences, and institutional activity without switching between timeframes.
**Original Concept Credits:** This indicator builds upon the HTF Candles framework by Fadi, adapting it specifically for volume analysis with enhanced features including gap-filling for extended hours, multiple scaling methods, and advanced synchronization.
## What Makes This Script Original
### Key Innovations:
1. **Three Volume Scaling Methods:**
- **Per-HTF Auto Scale:** Each timeframe scales independently for detailed comparison
- **Global Auto Scale:** All timeframes use unified scale for relative volume comparison
- **Manual Scale:** User-defined maximum for consistent analysis across sessions
2. **Bullish/Bearish Volume Differentiation:**
- Volume bars colored based on price movement (close vs open)
- Separate styling for bullish (green) and bearish (red) volume periods
- Helps identify whether volume supports price direction
3. **Advanced Time Synchronization:**
- Custom daily candle open times (Midnight, 8:30 AM, 9:30 AM ET)
- Timezone-aware calculations for New York trading hours
- Real-time countdown timers for each timeframe
- **Gap-filling technology** for continuous display during extended hours and weekends
4. **Flexible Display Options:**
- Configurable spacing and positioning
- Label placement (top, bottom, or both)
- Day-of-week or time interval labels on candles
- Works reliably in backtesting and live trading
## How It Works
### Volume Calculation
The indicator uses `request.security()` with optimized parameters to fetch volume data from higher timeframes:
- **Volume Open/High/Low/Close (OHLC):** Tracks volume changes within each HTF candle
- **Color Logic:** Compares HTF close vs open prices to determine bullish/bearish classification
- **Alignment:** All volume bars share a common baseline for easy visual comparison
- **Gap Handling:** Uses `gaps=barmerge.gaps_off` to maintain continuity during non-trading hours
### Technical Implementation
```
1. Monitors HTF timeframe changes using request.security() with lookahead
2. Creates new VolumeCandle object when HTF bar opens
3. Updates current candle's volume H/L/C on each chart bar
4. Applies selected scaling method to normalize display height
5. Repositions all candles and labels on each bar update
6. Fills gaps automatically during extended hours for consistent display
```
### Scaling Methods Explained
**Method 1 - Auto Scale per HTF:**
Each timeframe displays volume relative to its own maximum. Best for identifying patterns within each individual timeframe.
**Method 2 - Global Auto Scale:**
All timeframes share the same scale based on the highest volume across all HTFs. Best for comparing relative volume strength between timeframes.
**Method 3 - Manual Scale:**
User sets maximum volume value. Best for maintaining consistent scale across different trading sessions or instruments.
## How to Use This Indicator
### Setup
1. Add indicator to your chart (it appears in a separate panel below price)
2. Configure up to 6 higher timeframes (default: 5m, 15m, 1H, 4H, 1D, 1W)
3. Set number of candles to display for each timeframe
4. Choose volume scaling method based on your analysis needs
5. Enable "Fix gaps in non-trading hours" for extended hours trading (enabled by default)
### Interpretation
**Volume Spikes:**
- Sudden increase in volume height indicates institutional activity or strong conviction
- Compare volume between timeframes to identify where the real money is moving
- Look for volume spikes that appear across multiple timeframes simultaneously
**Bullish vs Bearish Volume:**
- **Green volume bars:** Price closed higher (buying pressure)
- **Red volume bars:** Price closed lower (selling pressure)
- High green volume during uptrend = confirmation of strength
- High red volume during downtrend = confirmation of weakness
- High volume opposite to trend = potential reversal warning
**Multi-Timeframe Context:**
- **5m/15m:** Scalping and day trading activity
- **1H/4H:** Swing trading and intraday institutional flows
- **Daily/Weekly:** Major position building and long-term trends
**Divergences:**
- Price making new highs but volume declining = weakening trend
- Volume increasing while price consolidates = potential breakout brewing
- Price breaks level but volume doesn't confirm = likely false breakout
### Practical Examples
**Example 1 - Institutional Confirmation:**
Price breaks above resistance. Check volume across timeframes:
- 5m shows spike = retail interest
- 15m + 1H + 4H all show spikes = institutional confirmation
- **Trade confidence: HIGH**
**Example 2 - False Breakout Detection:**
Price breaks resistance with:
- High volume on 5m only
- Normal/low volume on 1H and 4H
- **Interpretation:** Likely retail trap, institutions not participating
- **Action:** Wait for pullback or avoid
**Example 3 - Accumulation Phase:**
Price ranges sideways but:
- Daily volume gradually increasing
- Weekly volume above average
- **Interpretation:** Smart money accumulating
- **Action:** Prepare for breakout in direction of volume
**Example 4 - Volume Divergence:**
Price makes new high:
- Current high has lower volume than previous high across all timeframes
- **Interpretation:** Weakening momentum
- **Action:** Consider profit-taking or reversal trade
## Configuration Parameters
### Timeframe Settings
- **HTF 1-6:** Select timeframes (must be higher than chart timeframe)
- **Max Display:** Number of candles to show per timeframe (1-50)
- **Limit to Next HTFs:** Display only first N enabled timeframes (1-6)
### Styling
- **Bull/Bear Colors:** Separate colors for body, border, and wick
- **Padding from current candles:** Distance offset from live price action
- **Space between candles:** Gap between individual volume bars
- **Space between Higher Timeframes:** Gap between different timeframe groups
- **Candle Width:** Thickness of volume bars (1-4, multiplied by 2)
### Volume Settings
- **Volume Scale Method:** Choose 1, 2, or 3
- 1 = Auto Scale per HTF (each TF independent)
- 2 = Global Auto Scale (all TF unified)
- 3 = Manual Scale (user-defined max)
- **Auto Scale Volume:** Enable/disable automatic scaling
- **Manual Scale Max Volume:** Set maximum when using Method 3
### Label Settings
- **HTF Label:** Show/hide timeframe names with color and size options
- **Label Positions:** Display at Top, Bottom, or Both
- **Label Alignment:** Align centered or Follow Candles
- **Remaining Time:** Show countdown timer until next HTF candle
- **Interval Value:** Display day-of-week or time on each candle
### Custom Daily Candle
- **Enable Custom Daily:** Override default daily candle timing
- **Open Time Options:**
- **Midnight:** Standard 00:00 ET daily open
- **8:30 AM:** Align with economic data releases
- **9:30 AM:** Align with NYSE market open
- Useful for specific trading strategies or market alignment
### Advanced Settings
- **Fix gaps in non-trading hours:** Maintains alignment during extended hours and weekends (recommended: ON)
- Prevents visual gaps during forex weekend closures
- Ensures consistent display during crypto 24/7 trading
- Improves backtesting reliability
## Best Practices
1. **Pair with Price Action:** Use alongside HTF price candles indicator for complete picture
2. **Start Simple:** Enable 2-3 timeframes initially (e.g., 15m, 1H, 4H), add more as needed
3. **Match Settings:** Use same candle width/spacing as companion price indicator for visual alignment
4. **Scale Appropriately:**
- Use **Global scale** (Method 2) when comparing timeframes
- Use **Per-HTF scale** (Method 1) for pattern analysis within each timeframe
- Use **Manual scale** (Method 3) for consistent day-to-day comparison
5. **Watch for Volume Clusters:** High volume appearing simultaneously across multiple HTFs signals significant market events
6. **Confirm Breakouts:** Always check if volume supports the price movement across higher timeframes
7. **Extended Hours:** Keep "Fix gaps" enabled for 24/7 markets (Forex, Crypto) and weekend analysis
## Technical Notes
- **Timezone:** All calculations use America/New_York timezone for consistency
- **Real-time Updates:** Volume and timers update on each tick during market hours
- **Performance:** Optimized with max_bars_back=5000 for extensive historical analysis
- **Compatibility:** Works on all instruments with volume data (Stocks, Forex, Crypto, Futures)
- **Gap Handling:** Uses `barmerge.gaps_off` to fill data gaps during non-trading periods
- **Backtesting:** Uses `lookahead=barmerge.lookahead_on` for stable historical data without repainting
- **Data Continuity:** Automatically handles market closures, weekends, and extended hours
## Updates & Improvements
**Version 2.0 (Current):**
- ✅ Fixed alignment issues during extended hours and weekends
- ✅ Eliminated repainting in backtesting
- ✅ Added gap-filling technology for continuous display
- ✅ Improved data synchronization across all timeframes
- ✅ Enhanced NA value handling for data integrity
- ✅ Added advanced settings group for user control
## Support
For questions, suggestions, or feedback, please comment on the publication or message the author.
---
**Disclaimer:** This indicator is for educational and informational purposes only. It does not constitute financial advice. Past performance is not indicative of future results. Always perform your own analysis and implement proper risk management before making trading decisions.

Volume Percentile Supertrend [BackQuant]Volume Percentile Supertrend
A volatility and participation aware Supertrend that automatically widens or tightens its bands based on where current volume sits inside its recent distribution. The goal is simple: fewer whipsaws when activity surges, faster reaction when the tape is quiet.
What it does
Calculates a standard Supertrend framework from an ATR on a volume weighted price source.
Measures current volume against its recent percentile and converts that context into a dynamic ATR multiplier.
Widens bands when volume is unusually high to reduce chop. Tightens bands when volume is unusually low to catch turns earlier.
Paints candles, draws the active Supertrend line and optional bands, and prints clear Long and Short signal markers.
Why volume percentile
Fixed ATR multipliers assume all bars are equal. They are not. When participation spikes, price swings expand and a static band gets sliced.
Percentiles place the current bar inside a recent distribution. If volume is in the top slice, the Supertrend allows more room. If volume is in the bottom slice, it expects smaller noise and tightens.
This keeps the same playbook usable across busy sessions and sleepy ones without constant manual retuning.
How it works
Volume distribution - A rolling window computes the Pth percentile of volume. Above that is flagged as high volume. A lower reference percentile marks quiet bars.
Dynamic multiplier - Start from a Base Multiplier. If bar is high volume, scale it up by a function of volume-to-average and a Sensitivity knob. If bar is low volume, scale it down. Smooth the result with an EMA to avoid jitter.
VWMA source - The price input for bands is a short volume weighted moving average of close. Heavy prints matter more.
ATR envelope - Compute ATR on your length. UpperBasic = VWMA + Multiplier x ATR. LowerBasic = VWMA - Multiplier x ATR.
Trailing logic - The final lines trail price so they only move in a direction that preserves Supertrend behavior. This prevents sudden flips from transient pokes.
Direction and signals - Direction flips when price crosses through the relevant trailing line. SupertrendLong and SupertrendShort mark those flips. The plotted Supertrend is the active trailing side.
Inputs and what they change
Volume Lookback - Window for percentile and average. Larger window = stabler percentile, smaller = snappier.
Volume Percentile Level - Threshold that defines high volume. Example 70 means top 30 percent of recent bars are treated as high activity.
Volume Sensitivity - Gain from volume ratio to the dynamic multiplier. Higher = bands expand more when volume spikes.
VWMA Source Length - Smoothing of the volume weighted price source for the bands.
ATR Length - Standard ATR window. Larger = slower, smaller = quicker.
Base Multiplier - Core band width before volume adjustment. Think of this as your neutral volatility setting.
Multiplier Smoothing - EMA on the dynamic multiplier. Reduces back and forth changes when volume oscillates around the threshold.
Show Supertrend on chart - Toggles the active line.
Show Upper Lower Bands - Draws both sides even when inactive. Good for context.
Paint candles according to Trend - Colors bars by trend direction.
Show Long and Short Signals - Prints 𝕃 and 𝕊 markers at flips.
Colors - Choose your long and short palette.
Reading the plot
Supertrend line - Thick line that hugs price from above in downtrends and from below in uptrends. Its distance breathes with volume.
Bands - Optional upper and lower rails. Useful to see the inactive side and judge how wide the envelope is right now.
Signals - 𝕃 prints when the trend flips long. 𝕊 prints when the trend flips short.
Candle colors - Quick bias read at a glance when painting is enabled.
Typical workflows
Trend following - Use 𝕃 flips to initiate longs and ride while bars remain colored long and price respects the lower trailing line. Mirror for shorts with 𝕊 and the upper trailing line. During high volume phases the line will give more room, which helps stay in the move.
Pullback adds - In an established trend, shallow tags toward the active line after a high volume expansion can be add points. The dynamic envelope adjusts to the session so your add distance is not fixed to a stale volatility regime.
Mean reversion filter - In quiet tape the multiplier contracts and flips come earlier. If you prefer fading, watch for quick toggles around the bands when volume percentile remains low. In high volume, avoid fading into the widened line unless you have other strong reasons.
Notes on behavior
High volume bar: the percentile gate opens, volRatio > 1 powers up the multiplier through the Sensitivity lever, bands widen, fewer false flips.
Low volume bar: multiplier contracts, bands tighten, flips can happen earlier which is useful when you want to catch regime changes in quiet conditions.
Smoothing matters: both the price source (VWMA) and the multiplier are smoothed to keep structure readable while still adapting.
Quick checklist
If you see frequent chop and today feels busy: check that volume is above your percentile. Wider bands are expected. Consider letting the trend prove itself against the expanded line before acting.
If everything feels slow and you want earlier entries: percentile likely marks low volume, so bands tighten and 𝕃 or 𝕊 can appear sooner.
If you want more or fewer flips overall: adjust Base Multiplier first. If you want more reaction specifically tied to volume surges: raise Volume Sensitivity. If the envelope breathes too fast: raise Multiplier Smoothing.
What the signals mean
SupertrendLong - Direction changed from non-long to long. 𝕃 marker prints. The active line switches to support below price.
SupertrendShort - Direction changed from non-short to short. 𝕊 marker prints. The active line switches to resistance above price.
Trend color - Bars painted long or short help validate context for entries and management.
Summary
Volume Percentile Supertrend adapts the classic Supertrend to the day you are trading. Volume percentile sets the mood, sensitivity translates it into dynamic band width, and smoothing keeps it clean. The result is a single plot that aims to stay conservative when the tape is loud and act decisively when it is quiet, without you having to constantly retune settings.

Volume Density AnalysisVolume Density Analysis
Overview
The "Volume Density Analysis" indicator is designed to provide traders with insights into volume dynamics relative to price movements. By analyzing the density of volume against price spread, this indicator helps identify potential reversal points and extreme volume conditions, enhancing decision-making in trading strategies.
Key Features
Volume Density Calculation: The indicator computes the density of volume by dividing the total volume by the price spread (high - low) for each bar. This allows for a more nuanced understanding of volume activity in relation to price movements.
Extremum Detection: Users can specify the number of bars to consider when identifying extreme volume conditions, allowing for tailored analysis based on market behavior.
Reversal Bar Conditions: The indicator includes options to determine if low or high volume bars must coincide with reversal patterns, providing additional context for potential trade signals.
Dynamic Coloring*: The histogram displays colored bars based on specific conditions:
Blue Bars: Indicate the lowest and highest volume density within a specified range, highlighting significant volume extremes.
Gray Bars: Represent lower or higher volume density that meets reversal criteria.
Green and Red Bars: Indicate bullish or bearish reversal signals based on historical density patterns.
User Inputs
nl: Number of previous lower bars to consider for comparison (default is 8).
nh: Number of previous higher bars to consider for comparison (default is 8).
ext: Number of bars for detecting extremum volume (default is 30).
LReversalBar: Boolean option to determine if low volume bar spread must indicate a reversal.
HReversalBar: Boolean option to determine if high volume bar spread must indicate a reversal.
Suggested Timeframes
M15: Without reversal considerations, use `nl=3`, `nh=3`, and `ext=20`.
M5: Without reversal considerations, use `nl=4`, `nh=4`, and `ext=35`.
M1: Use `nl=8`, `nh=8`, and `ext=58` for more detailed analysis.
Uptrick: Volume StrengthPurpose:
The "Uptrick: Volume Strength" indicator, known by its short title 'VolStrength,' is meticulously designed to evaluate the strength of volume activity within a market, providing traders with valuable insights into liquidity dynamics. By visualizing volume bars and comparing them to a predefined threshold, traders can gauge the intensity of buying or selling pressure, thereby assessing market liquidity and potential price movements.
Explanation:
Input Parameters:
Traders benefit from the ability to customize the threshold for high volume, allowing them to adapt the indicator to varying market conditions and trading strategies.
The calculation of the average volume over a specified period adds depth to the analysis, offering traders a reference point for assessing current volume levels relative to historical averages and evaluating liquidity trends.
Volume Analysis:
The script discerns between bars where the closing price exceeds the opening price (up bars) and bars where the closing price is lower than the opening price (down bars), facilitating the identification of bullish or bearish market sentiment.
High-volume bars that surpass the predefined threshold are prominently highlighted, serving as indicators of increased trading activity and enhanced liquidity levels.
Average Volume Visualization:
A line representing the average volume over the specified period is plotted on the chart, providing traders with a visual reference for evaluating current volume levels against historical averages. This aids in assessing the overall liquidity conditions in the market.
Volume Bar Representation:
The colorization of volume bars is contingent upon their direction (up or down) and whether they exceed the high volume threshold.
Up bars, symbolizing buying pressure, are typically depicted in green, while down bars, indicative of selling pressure, are rendered in red.
Notably, when volume surpasses the high volume threshold, the respective bar color is applied, accentuating significant volume spikes and their potential impact on liquidity and price dynamics.
Through its meticulous design and comprehensive features, the "Uptrick: Volume Strength" indicator equips traders with actionable insights into market liquidity dynamics. By integrating volume analysis into their trading strategies, traders can effectively assess liquidity conditions, identify potential price movements, and make informed trading decisions.

[TTI] High Volume Close (HVC) Setup📜 ––––HISTORY & CREDITS––––
The High Volume Close (HVC) Setup is a specialised indicator designed for the TradingView platform used to identify specific bar. This tool was developed with the objective of identifying a technical pattern that trades have claimed is significant trading opportunities through a unique blend of volume analysis and price action strategies. It is based on the premise that high-volume bars, when combined with specific price action criteria, can signal key market movements.
The HVC is applicable both for swing and longer term trading and as a technical tool it can be used by traders of any asset type (stocks, ETF, crypto, forex etc).
🦄 –––UNIQUENESS–––
The uniqueness of the HVC Setup lies in its flexibility to determine an important price level based on historically important bar. The idea is to identify significant bars (e.g. those who have created the HIGHEST VOLUME: Ever, Yearly, Quarterly and meet additional criteria from the settings) and plot on the chart the close on that day as a significant level as well as theoretical stop loss and target levels. This approach allows traders to discern high volume bars that are contextually significant — a method not commonly found in standard trading tools.
🎯 ––––WHAT IT DOES––––
The HVC Setup indicator performs a series of calculations to identify high volume close bars/bar (HVC bars) based on the user requirements.
These bars are determined based on the highest volume recorded within a user-inputs:
👉 Period (Ever, Yearly, Quarterly) and must meet additional criteria such as:
👉 a minimum percentage Price Change (change is calculated based on a close/close) and
👉 specific Closing Range requirements for the HVC da.
The theory is that this is a significant bar that is important to know where it is on the chart.
The script includes a comparative analysis of the HVC bar's price against historical price highs (all-time, yearly, quarterly), which provides further context and significance to the identified bars. All of these USER input requirement are then taken into account as a condition to identity the High Volume Close Bar (HVC).
The visual representation includes color-coded bar (default is yellow) and lines to delineate these key trading signals. It then draws a blue line for the place where the close ofthe bar is, a red line that would signify a stop loss and 2 target profit levels equal to 2R and 3R of the risked level (close-stop loss). Additional lines can be turned on/off with their coresponding checkboxes in the settings.
If the user chooses "Ever" for Period - the script will look at the first available bar ever in Tradingview - this is generally the IPO bar;
If the users chooses "Yearly" - the script would look at the highest available bar for a completed year;
If the users chooses "Quarterly" - it would do the same for the quarter. (works on daily timeframe only);
While we have not backtested the performance of the script, this methodology has been widely publicised.
🛠️ ––––HOW TO USE IT––––
To utilize the HVC Setup effectively:
👉Customize Input Settings: Choose the HVC period, percentage change threshold, closing range, stop loss distance, and target multiples according to your trading strategy. Use the tick boxes to enable and disable if a given condition is used within the calculation.
👉Identify HVC Bars: The script highlights HVC bars, indicating potential opportunities based on volume and price action analysis.
👉Interpret Targets and Stop Losses: Use the color-coded lines (green for targets, red for stop losses) to guide your trade entries and exits.
👉Contextual Analysis: Always consider the HVC bar signals in conjunction with overall market trends and additional technical indicators for comprehensive trading decisions.
This script is designed to assist traders in identifying high-potential trading setups by using a combination of volume and price analysis, enhancing traditional methods with a unique, algorithmically driven approach.

Periodic Activity Tracker [LuxAlgo]The Periodic Activity Tracker tool periodically tracks the cumulative buy and sell volume in a user-defined period and draws the corresponding matching bars and volume delta for each period.
Users can select a predefined aggregation period from the following options: Hourly, Daily, Weekly, and Monthly.
🔶 USAGE
This tool provides a simple and clear way of analyzing volumes for each aggregated period and is made up of the following elements:
Buy and sell volumes by period as red and green lines with color gradient area
Delta (difference) between buy & sell volume for each period
Buy & sell volume bars for each period
Separator between lines and bars, and period tags below each pair of bars for ease of reading
On the chart above we can see all the elements displayed, the volume level on the lines perfectly matches the volume level on the bars for each period.
In this case, the tool has the default settings so the anchor period is set to Daily and we can see how the period tag (each day of the week) is displayed below each pair of bars.
Users can disable the delta display and adjust the bar size.
🔹 Reading The Tool
In trading, assessing the strength of the bulls (buyers) and bears (sellers) is key to understanding the current trading environment. Which side, if any, has the upper hand? To answer this question, some traders look at volume in relation to price.
This tool provides you with a view of buy volume versus sell volume, allowing you to compare both sides of the market.
As with any volume tool, the key is to understand when the forces of the two groups are balanced or unbalanced.
As we can observe on the chart:
NOV '23: Buy volume greater than sell volume, both moving up close together, flat delta. We can see that the price is in range.
DEC '23: Buy volume bigger than Sell volume, both moving up but with a bigger difference, bigger delta than last month but still flat. We can see the price in the range above last month's range.
JAN '24: Buy and sell volume tied together, no delta whatsoever. We can see the price in range but testing above and below last month's range.
FEB '24: Buy volume explodes higher and sell volume cannot keep up, big growing delta. Price explodes higher above last month's range.
Traders need to understand that there is always an equal number of buyers and sellers in a liquid market, the quality here is how aggressive or passive they are. Who is 'attacking' and who is 'defending', who is using market orders to move prices, and who is using limit orders waiting to be filled?
This tool gives you the following information:
Lines: if the top line is green, the buyers are attacking, if it is red, the sellers are attacking.
Delta: represents the difference in their strength, if it is above 0 the buyers are stronger, if it is below 0 the sellers are stronger.
Bars: help you to see the difference in strength between buyers and sellers for each period at a glance.
🔹 Anchor Period
By default, the tool is set to Hourly. However, users can select from a number of predefined time periods.
Depending on the user's selection, the bars are displayed as follows:
Hourly : hours of the current day
Daily : days of the current week
Weekly : weeks of the current month
Monthly : months of the current year
On the chart above we can see the four periods displayed, starting at the top left and moving clockwise we have hourly, daily, weekly, and monthly.
🔶 DETAILS
🔹 Chart TimeFrame
The chart timeframe has a direct impact on the visualization of the tool, and the user should select a chart timeframe that is compatible with the Anchor period in the tool's settings panel.
For the chart timeframe to be compatible it must be less than the Anchor period parameter. If the user selects an incompatible chart timeframe, a warning message will be displayed.
As a rule of thumb, the smaller the chart timeframe, the more data the tool will collect, returning indications for longer-term price variations.
These are the recommended chart timeframes for each period:
Hourly : 5m charts or lower
Daily : 1H charts or lower
Weekly : 4H charts or lower
Monthly : 1D charts or lower
🔹 Warnings
This chart shows both types of warnings the user may receive
At the top, we can see the warning that is given when the 'Bar Width' parameter exceeds the allowed value.
At the bottom is the incompatible chart timeframe warning, which prompts the user to select a smaller chart timeframe or a larger "Anchor Period" parameter.
🔶 SETTINGS
🔹 Data Gathering
Anchor period: Time period representing each bar: hours of the day, days of the week, weeks of the month, and months of the year. The timeframe of the chart must be less than this parameter, otherwise a warning will be displayed.
🔹 Style
Bars width: Size of each bar, there is a maximum limit so a warning will be displayed if it is reached.
Volume color
Delta: Enable/Disable Delta Area Display
